The Arctic entered the new ice age after the Holocene Climate Optimum 8,000 years ago. Between 6000 BCE and 1700 CE the Arctic temperature declined 5deg.C before entering the most extreme global warming phase from 1700-2016. This decline in Arctic temperature since the climate optimum paralleled a 40-50 Watt/m2 decline in total solar irradiance, and a large ice build up to the mid-19th century. To give perspective to today’s global mean surface temperature we must look beyond 1880, back to the Holocene Climate Optimum and preceding glacial cycles, and look at the polar ice core climate reconstructions. Otherwise, we are susceptible to manipulation by those wielding the global mean surface temperature since 1880 and telling us its the hottest on record.
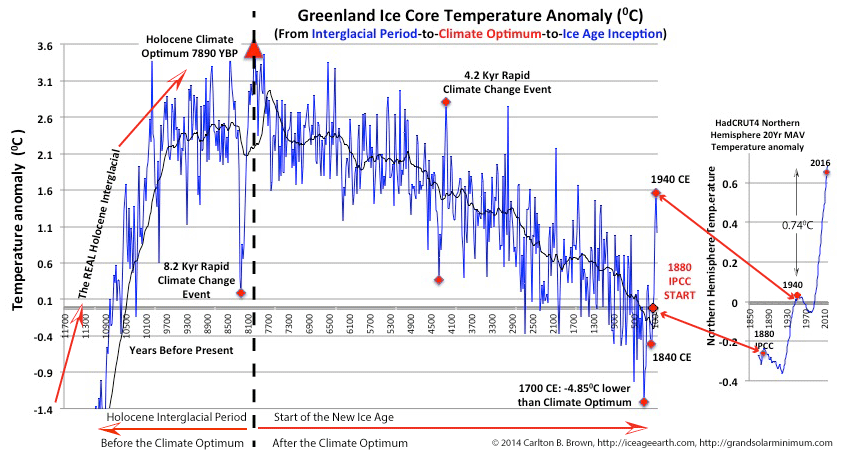
A graphic of Greenland’s ice core climate reconstruction from 9080 BCE (after the Younger Dryas) to 1960 CE is positioned alongside a 20-year moving average of the Northern Hemisphere temperature anomaly (1870 to 2018; right hand diagram).[i] This depicts how the modern instrument era-derived Northern Hemisphere temperature data relates to Greenland’s ice core temperature data. This juxtaposition of different climate data was done to give an approximate bearing on today’s climate relative to the climate optimum.
Greenland’s ice temperature actually declined by 4.860C between the Holocene Climate Optimum in 5980 BCE (peak temperature) and 1700 CE, or about one-fifth of the Arctic’s interglacial temperature rise.[ii] This decline in Arctic temperature parallels a 40-50 Watts/m2 decline in solar irradiance, since the climate optimum and due to changes in earth’s orbit (inducing a precession of the summer solstice).[iii],[iv],[v],[vi] This decline in solar irradiance is some 15 times the theoretical radiative forcing impact of today’s greenhouse gas emissions,[vii] and gives perspective to human greenhouse gas emissions.
From 1700-1940 the Arctic climate entered a centennial-scale warming phase (an oscillation) with the temperature rising 2.870C. This was the most extreme temperature rise of 39 warming phases over the last 8,000 years,[viii] and yet rose still further between 1940 and 2016. By comparing today’s temperature with only that in 1880 we are being misled to believe that a 1.020C rise in temperature since 1880 is the highest on record.[ix] However, when today’s temperature is compared with the Holocene Climate Optimum’s temperature 7,980 years ago, then that highest rise in temperature on record actually represents a decline of 20C. Moving beyond the above data, the Arctic is generally recognized to be 2-40C lower in temperature than at the Holocene Climate Optimum.[x],[xi],[xii]
The Arctic ice core data emphatically tells us that we have already entered an ice age 8,000 years ago, and entered a global warming phase between 1700 and 2016 (which has putatively come to an end in 2016).
Click on this page and download a free copy of my book “Revolution: Ice Age Re-Entry,” and read more about this topic in Chapter 4.
[i] Data: (1) B.M. Vinther et al., 2009, “Holocene thinning of the Greenland ice sheet.” Nature, Vol. 461, pp. 385-388, 17 September 2009. National Centers for Environmental Information, NESDIS, NOAA, U.S. Department of Commerce. Greenland Ice Sheet Holocene d18O, Temperature, and Surface Elevation. doi:10.1038/nature08355. https://www.ncdc.noaa.gov/paleo-search/study/11148. Downloaded 05/05/2018. (2) HadCRUT4 near surface temperature data set for the Northern Hemisphere. http://www.metoffice.gov.uk/hadobs/hadcrut4/data/current/download.html. Downloaded 25 July 2018.
[ii] R.B. Alley, 2004, “GISP2 Ice Core Temperature and Accumulation Data.” National Centers for Environmental Information, NESDIS, NOAA, U.S. Department of Commerce. https://www.ncdc.noaa.gov/paleo/study/2475. Downloaded 5/5/2018. [Last Glacial Maximum’s deepest temperature trough was 24,098 years ago (-530C) and the Holocene Climate Optimum was 7,800 years ago (-28.860C). The difference between these time points is 16,297 years and 24.560C.]
[iii] H. Wanner et al., “Structure and origin of Holocene cold events.” Quaternary Science Reviews (2011), doi:10.1016/j.quascirev.2011.07.010. [Comment: See Figure 5a, page 9, depicting the steady decline in Northern Hemisphere summer solar insolation at north 15 and 65 degree latitudes, and indicating that insolation has declined by 40 W/m2. This is based on the landmark research by Berger, 1978 (André Berger, Long-Term Variations of Daily Insolation and Quaternary Climatic Changes. 1978. Journal of the Atmospheric Sciences 35(12):2362-2367. DOI: 10.1175/1520-0469(1978)035<2362:LTVODI>2.0.CO;2).].
[iv] D.S. Kaufman et al., “Holocene thermal maximum in the western Arctic (0–180°W).” Quaternary Science Reviews, Volume 23, Issues 5–6, 2004, 529-560. https://doi.org/10.1016/j.quascirev.2003.09.007. [Comment: See the abstract. We are told that the precession-driven summer insolation anomaly peaked 12,000-10,000 years ago. See also Figure 9a which depicts the 65°N insolation anomaly at different times of the year, indicating an approximate 50 Wm-2 decline in summer solstice insolation from its peak 12,000-10,000 years ago.].
[v] Darrell Kaufman et al., “Recent Warming Reverses Long-Term Arctic Cooling.” September 2009. Science 325(5945):1236-1239. DOI: 10.1126/science.1173983. [Comment: This publication details the Arctic cooling that has been in progress for the last 2,000 years until this recent global warming phase. This millennial-scale cooling trend correlates (r = +0.87 with a R-squared 0.76, see Figure 4.) with a reduction in precession of the solstice driven summer insolation (6 W m−2 insolation at 65°N) for the last 2,000 years. See Figure 3F. The publication indicates a temperature decline of 0.22° ± 0.06°C per 1000 years, which tracks the slow decline in orbitally driven summer insolation at high northern latitudes.].
[vi] I. Borzenkova et al., 2015. Climate Change During the Holocene (Past 12,000 Years). In: The BACC II Author Team (eds) Second Assessment of Climate Change for the Baltic Sea Basin. Regional Climate Studies. Springer. https://link.springer.com/content/pdf/10.1007%2F978-3-319-16006-1.pdf
[vii] US Environmental Protection Agency. Climate Change Indicators: Climate Forcing. https://www.epa.gov/climate-indicators/climate-change-indicators-climate-forcing#ref1.
[viii] Data: (1) B.M. Vinther et al., 2009, “Holocene thinning of the Greenland ice sheet.” Nature, Vol. 461, pp. 385-388, 17 September 2009. National Centers for Environmental Information, NESDIS, NOAA, U.S. Department of Commerce. Greenland Ice Sheet Holocene d18O, Temperature, and Surface Elevation. doi:10.1038/nature08355. https://www.ncdc.noaa.gov/paleo-search/study/11148. Downloaded 05/05/2018. (2) HadCRUT4 near surface temperature data set for the Northern Hemisphere. http://www.metoffice.gov.uk/hadobs/hadcrut4/data/current/download.html. Downloaded 25 July 2018. Personal Research: All 39 climate trough-to-peak temperature rises exceeding +0.990C, between 5980 BCE and 1940 CE were extracted from the temperature data, derived from the Greenland ice core, for group analysis (range, +0.990C to +2.870C, average 77.4 years trough-to-peak, n=39).
[ix] Global mean surface temperature data, commonly referred to as HadCRUT4. https://www.metoffice.gov.uk/hadobs/hadcrut4/data/current/download.html. [Exposé: Look at the bottom left hand or first column for the current year-to-date temperature. Subtract that from the 2016 total to see the magnitude of the fall. Global Data: https://bit.ly/2nCgctz. Northern Hemisphere Data: https://bit.ly/2MRt75G, Southern Hemisphere Data: https://bit.ly/2nBfYTA. Tropics Data: https://bit.ly/2nFXJMM. [last downloaded 25/07/2018].
[x] Nicolaj K. Larsen et al., “The response of the southern Greenland ice sheet to the Holocene thermal maximum.” Geology ; 43 (4): 291–294. doi: https://doi.org/10.1130/G36476.1.
[xi] D.S. Kaufman et al., “Holocene thermal maximum in the western Arctic (0–1800W).” Quaternary Science Reviews 23 (2004) 529–560.
[xii] J.P. Briner et al., “Holocene climate change in Arctic Canada and Greenland.” Quaternary Science Reviews (2016), http://dx.doi.org/10.1016/j.quascirev.2016.02.010.