Earth entered the Ice Age after the Holocene Climate Optimum
We are disoriented as to the correct stage of the glacial cycle that we exist in today. This disorientation arose because we focus on the global mean surface temperature rather than the polar temperatures, and we do not look beyond 1880 CE and back to the Holocene Climate Optimum when interpreting climate data. We can thank the Intergovernmental Panel on Climate Change for much of this enforced disorientation as they manipulate us with “out of context” climate data.
Earth entered a new ice age after the Holocene Climate Optimum
The Last Ice Age Ended 20,000–24,000 Years Ago, Not 11,700 Years Ago
A new ice age was entered after the Arctic Holocene Climate Optimum
Glacier ice build up peaked during the Little Ice Age
Abrupt global cooling happens after extreme global warming phases
Slowest ice age entry temperature decline in two million years
Slowest ice age entry temperature decline in 800,000 years (Antarctica)
A glacial cycle is comprised of sequential freeze-thaw phases
Solar activity controls the climate system, and global warming started in 1700
Cold climates follow a grand solar minimum of solar activity (magnetism)
Earth entered the Ice Age millennia ago and today’s “global warming” leaves the Arctic 2-40C lower than at the Holocene Climate Optimum 8,000 years ago.
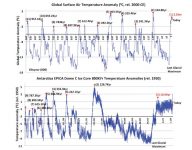
Polar ice cores retrieved by scientists reveal the peak in the Holocene interglacial temperature occurred 8 and 10.5 millennia ago in the Arctic and Antarctic respectively. This means earth actually entered the current Ice Age 8 and 10.5 millennia ago in the Arctic and Antarctic respectively.[i],[ii],[iii] Since the Holocene Climate Optimum 8,000 years ago, the Greenland ice core declined in an oscillating manner to its lowest temperature trough by 1700 (a 4.90C decline), before increasing to 2016’s global warming sub-peak.[iv]
By 1880, or the start of the modern instrument era for recording global temperatures and the period used by the IPCC to begin its anthropogenic global warming story, the Greenland ice core temperature was still 3.60C lower than at the Holocene Climate Optimum.[v] Despite being told recent temperatures are the highest on record,[vi] the temperature was actually 20C to 40C higher in the Arctic during the Holocene Climate Optimum than it is today.[vii],[viii],[ix]
It is important to keep in mind that current global warming trends peaked in 2016, but this temperature peak was still about 20C lower than at the Holocene Climate optimum 8,000 years ago.[x] To give you some perspective, the Greenland GISP2 ice core registered a temperature rise of 24.50C from the last glacial maximum (coldest trough) 24,000 years ago to the Holocene Climate Optimum (warmest peak) 8,000 years ago.[xi] This means that by 1700 CE, the ice core had actually dropped about 20 percent of its full decline for one glacial cycle, and we were at about 8 percent of the full temperature decline of one glacial cycle in 2016.
We are completely disoriented as regards what stage of the glacial cycle we are living in. Science tells us the last ice age ended 11,700 years ago,[xii], whereas in reality that was the end of a rapid climate change event called the Younger Dryas.[xiii] The last ice age ended 19,000 and 24,000 years ago in the Antarctic[xiv] and Arctic[xv] respectively, after the last glacial cycle’s deepest temperature trough. There was also less ice at both poles during the Holocene Climate Optimum than exists today.[xvi],[xvii],[xviii],[xix],[xx]
Beginning about 5,000 years ago, ice began to accumulate at the poles, and northeast Greenland was ice-locked by 3,000 years ago.[xxi],[xxii],[xxiii],[xxiv] Glacier ice rapidly accumulated during the Little Ice Age, reaching its peak buildup by the mid-19th century.[xxv],[xxvi] Much of this glacier ice melted after the mid-19th century[xxvii],[xxviii],[xxix] as the sun passed through its 20th century grand solar maximum phase.
[i] B.M. Vinther et al., 2009. “Holocene thinning of the Greenland ice sheet.” Nature, Vol. 461, pp. 385-388, September 17, 2009. National Centers for Environmental Information, NESDIS, NOAA, U.S. Department of Commerce. Greenland Ice Sheet Holocene d18O, Temperature, and Surface Elevation. doi:10.1038/nature08355. https://www.ncdc.noaa.gov/paleo-search/study/11148. Downloaded 05/05/2018. [See the data point at 7,980 years, +3.550C = peak temperature anomaly at the end of the Holocene interglacial or at the Holocene Climate Optimum compared with the reference year 2000 CE].
[ii] J.V. Jouzel et al., 2007. “Orbital and Millennial Antarctic Climate Variability over the Past 800,000 Years.” Science, Volume 317, No. 5839, 793-797, 10 August 2007. National Centers for Environmental Information, NESDIS, NOAA, U.S. Department of Commerce. EPICA Dome C – 800KYr Deuterium Data and Temperature Estimates. https://www.ncdc.noaa.gov/paleo/study/6080. Download data: Downloaded 08/02/2016. [See the data point at 10,527 years, +2.12°C = peak temperature anomaly at the end of the Holocene interglacial compared with 1950.].
[iii] R. Uemura, et al., 2012. “Ranges of moisture-source temperature estimated from Antarctic ice cores stable isotope records over glacial-interglacial cycles.” Climate of the Past, 8, 1109-1125. doi: 10.5194/cp-8-1109-2012. National Centers for Environmental Information, NESDIS, NOAA, U.S. Department of Commerce. Dome Fuji 360KYr Stable Isotope Data and Temperature Reconstruction. https://www.ncdc.noaa.gov/paleo-search/study/13121. Downloaded 5/5/2018. [See the data point at Tsite(°C) at 10.1Kyr +1.35°C = peak temperature anomaly at the end of the Holocene interglacial compared with 2000 CE (B2K)].
[iv] Global mean surface temperature data, commonly referred to as HadCRUT4. https://www.metoffice.gov.uk/hadobs/hadcrut4/data/current/download.html. [Exposé: Look at the bottom left hand or first column for the current year-to-date temperature. Subtract that from the 2016 total to see the magnitude of the fall. Global Data: https://bit.ly/2nCgctz. Northern Hemisphere Data: https://bit.ly/2MRt75G, Southern Hemisphere Data: https://bit.ly/2nBfYTA. Tropics Data: https://bit.ly/2nFXJMM. [last downloaded 25/07/2018].
[v] B.M.Vinther et al., 2009. “Holocene thinning of the Greenland ice sheet.” Nature, Vol. 461, pp. 385-388, 17 September 2009. National Centers for Environmental Information, NESDIS, NOAA, U.S. Department of Commerce. Greenland Ice Sheet Holocene d18O, Temperature, and Surface Elevation. doi:10.1038/nature08355. https://www.ncdc.noaa.gov/paleo-search/study/11148. Downloaded 05/05/2018. [Comment: This calculation was based on the difference between peak temperature 7,980 years ago at the Holocene Climate Optimum, and the temperature recorded in 1880.].
[vi] IPCC, 2007: Climate Change 2007: The Physical Science Basis. Contribution of Working Group I to the Fourth Assessment Report of the Intergovernmental Panel on Climate Change [Solomon, S., D. Qin, M. Manning, Z. Chen, M. Marquis, K.B. Averyt, M. Tignor and H.L. Miller (eds.)]. Cambridge University Press, Cambridge, United Kingdom and New York, NY, USA, 996 [See page 288 where we are told that sea surface temperature and the global mean temperature anomalies (1998) were the highest on record until 2005 (global mean temperature).].
[vii] Nicolaj K. Larsen et al., “The response of the southern Greenland ice sheet to the Holocene thermal maximum.” Geology ; 43 (4): 291–294. doi: https://doi.org/10.1130/G36476.1.
[viii] D.S. Kaufman et al., Holocene thermal maximum in the western Arctic (0–1800W). Quaternary Science Reviews 23 (2004) 529–560.
[ix] J.P. Briner et al., “Holocene climate change in Arctic Canada and Greenland,” Quaternary Science Reviews (2016), http://dx.doi.org/10.1016/j.quascirev.2016.02.010.
[x] Data: (1) B.M. Vinther et al., 2009. “Holocene thinning of the Greenland ice sheet.” Nature, Vol. 461, pp. 385-388, September 17, 2009. National Centers for Environmental Information, NESDIS, NOAA, U.S. Department of Commerce. Greenland Ice Sheet Holocene d18O, Temperature, and Surface Elevation. doi:10.1038/nature08355. https://www.ncdc.noaa.gov/paleo-search/study/11148. Downloaded 05/05/2018. (2) HadCRUT4 near surface temperature data set for the Northern Hemisphere. http://www.metoffice.gov.uk/hadobs/hadcrut4/data/current/download.html. Downloaded July 25, 2018. Personal Research: Between the Holocene Climate Optimum (HCO) 5980 BCE and 1700 CE the Greenland temperature anomaly (derived from the ice core) declined 4.860C. Between 1700-1940 the temperature rose 2.870C. From this data, it was calculated that the temperature in 2016 was 1.910C lower than at the Holocene Climate Optimum. 1700-1960 rise = 2.320C rise plus a “graft-on” of a 1960-2016 temperature anomaly rise of 0.630C. To determine the 1960-2016 temperature anomaly rise the HADCRUT4 Northern Hemisphere near surface temperature data was utilized to create a 20-year moving average, to graft on to the 1700-1960 (+0.630C). HCO-2016 approximation = -4.860C + 2.320C +0.630C = -1.910C.
[xi] R.B. Alley, 2004, “GISP2 Ice Core Temperature and Accumulation Data.” National Centers for Environmental Information, NESDIS, NOAA, U.S. Department of Commerce. https://www.ncdc.noaa.gov/paleo/study/2475. Downloaded 5/5/2018. [Last Glacial Maximum’s deepest temperature trough was 24,098 years ago (-530C) and the Holocene Climate Optimum was 7,800 years ago (-28.860C). The difference between these time points is 16,297 years and 24.560C.]
[xii] M. Walker et al., 2009, “Formal definition and dating of the GSSP (Global Stratotype Section and Point) for the base of the Holocene using the Greenland NGRIP ice core, and selected auxiliary records.” J. Quaternary Sci., Volume 24 3–17. ISSN 0267‐8179.
[xiii] A.E. Carlson, 2013. “The Younger Dryas Climate Event.” In: Elias S.A. (ed.) The Encyclopedia of Quaternary Science, Volume 3, 126-134. Amsterdam: Elsevier. http://people.oregonstate.edu/~carlsand/carlson_encyclopedia_Quat_2013_YD.pdf
[xiv] R. Uemura, et al., 2012. “Ranges of moisture-source temperature estimated from Antarctic ice cores stable isotope records over glacial-interglacial cycles.” Climate of the Past, 8, 1109-1125. doi: 10.5194/cp-8-1109-2012.. National Centers for Environmental Information, NESDIS, NOAA, U.S. Department of Commerce. Dome Fuji 360KYr Stable Isotope Data and Temperature Reconstruction. https://www.ncdc.noaa.gov/paleo-search/study/13121. Downloaded 05/05/2018.
[xv] R.B. Alley, 2004. “GISP2 Ice Core Temperature and Accumulation Data.” National Centers for Environmental Information, NESDIS, NOAA, U.S. Department of Commerce. https://www.ncdc.noaa.gov/paleo/study/2475. Downloaded 05/05/2018.
[xvi] K. Nicolaj et al., “The response of the southern Greenland ice sheet to the Holocene thermal maximum.” Geology; 43 (4): 291–294. doi: https://doi.org/10.1130/G36476.1.
[xvii] J.P. Briner et al., “Holocene climate change in Arctic Canada and Greenland.” Quaternary Science Reviews (2016), http://dx.doi.org/10.1016/j.quascirev.2016.02.010.
[xviii] Leonid Polyak et al., “History of sea ice in the Arctic.” Quaternary Science Reviews 29 (2010) 1757–1778, https://doi.org/10.1016/j.quascirev.2010.02.010.
[xix] Jason P. Briner et al. “Holocene climate change in Arctic Canada and Greenland.” Quaternary Science Reviews, Volume 147, 2016, 340-364, ISSN 0277-3791. https://doi.org/10.1016/j.quascirev.2016.02.010.
[xx] Ó Ingólfsson et al., 1998, “Antarctic glacial history since the Last Glacial Maximum: An overview of the record on land.” Antarctic Science, 10(3), 326-344. doi:10.1017/S095410209800039X.
[xxi] Leonid Polyak et al. “History of sea ice in the Arctic.” Quaternary Science Reviews 29 (2010) 1757–1778, https://doi.org/10.1016/j.quascirev.2010.02.010
[xxii] N.L. Balascio et al. “Glacier response to North Atlantic climate variability during the Holocene.” Climate of the Past, 11, 1587-1598, https://doi.org/10.5194/cp-11-1587-2015, 2015.
[xxiii] The RAISED Consortium1, Michael J. Bentley et al., “A community-based geological reconstruction of Antarctic Ice Sheet deglaciation since the Last Glacial Maximum.” Quaternary Science Reviews. Volume 100, 15 September 2014, 1-9.
[xxiv] M. Frezzotti1 et al. “A synthesis of the Antarctic surface mass balance during the last 800 years.” The Cryosphere, 7, 303–319, 2013. www.the-cryosphere.net/7/303/2013/doi:10.5194/tc-7-303-2013 © Author(s) 2013. CC Attribution 3.0 License.
[xxv] O.N. Solomina et al., 2016, “Glacier fluctuations during the past 2000 years.” Quaternary Science Reviews, 149, 61-90. DOI: 10.1016/j.quascirev.2016.04.008. [See Figure 5, page 276. This figure collates a stacked time series of the number of glacier advances and recessions in each region into a global total.].
[xxvi] Michael E Mann. “Little Ice Age.” Volume 1, The Earth system: physical and chemical dimensions of global environmental change, 504–509. In Encyclopedia of Global Environmental Change (ISBN 0-471-97796-9).
[xxvii] Leonid Polyak et al., “History of sea ice in the Arctic.” Quaternary Science Reviews 29 (2010) 1757–1778, https://doi.org/10.1016/j.quascirev.2010.02.010
[xxviii] Christophe Kinnard et al., “A changing Arctic seasonal ice zone: Observations from 1870–2003 and possible oceanographic consequences.” Geophysical Research Letters, Volume 35, L02507, doi:10.1029/2007GL032507, 2008.
[xxix] O.N. Solomina et al., (2016). “Glacier fluctuations during the past 2000 years.” Quaternary Science Reviews, 149, 61-90. DOI: 10.1016/j.quascirev.2016.04.008. [See Figure 5, page 276. This figure collates a stacked time series of the number of glacier advances and recessions in each region into a global total.].