Solar activity (magnetism) controls centennial-scale climate change, not carbon dioxide. Global warming started in 1700 before significant human activity. The rise in carbon dioxide (CO2) concentrations lags the global temperature rise, while CO2 does not track decadal-scale climate change (i.e., the temperature ups and downs). The Intergovernmental Panel on Climate Change (IPCC) “anthropogenic global warming” story started after 1880 and is a partial fragment of this natural global warming phase.
The 1700–2016 CE centennial-scale warming phase was the most extreme statistical “outlier” climate oscillation in 8,000 years. Even at 2016’s global warming temperature peak, the Arctic temperatures were still 2-4C lower than at the Holocene Climate Optimum 8,000 years ago.[i],[ii],[iii] Today’s temperature is not the highest on record, as claimed by the IPCC.[iv]
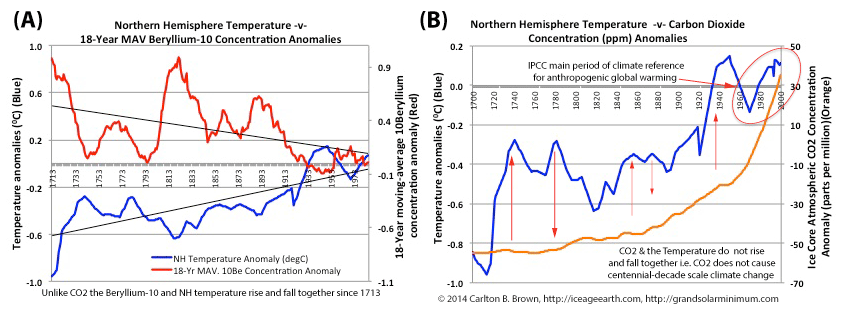
Figure A) above: The Northern Hemisphere temperature anomaly highlights a strong inverse correlation with the 18-year moving average Beryllium-10 concentration anomaly (“Beryllium-10”, is a proxy for solar activity). In 1711, the 18-year moving average Beryllium-10 began its decline phase (i.e., coinciding with an increase in solar activity). The temperature rise began two years later in 1713, which was the lowest temperature since the Holocene Climate Optimum. Figure A tells us the temperature lagged behind the rise in solar activity.
The use of an 18-year moving average for the Beryllium-10 concentration anomaly means the temperature, in reality, lagged the solar activity by at least one 11-year solar cycle (see citation for why).[v] These two parameters also well tracked one another’s up and down variations, putatively supporting a cause-and-effect relationship.
By contrast, since 1713 the rising carbon dioxide concentration has poorly tracked the Northern Hemisphere temperature volatility on multi-annual and decade time-scales (see Figure B). This indicates carbon dioxide is consequential to, and not causative of, the 1700-2000 temperature rise.[vi]
The above conclusion that carbon dioxide follows (i.e., does not cause) the temperature rise is fully aligned with the science of carbon dioxide and earth’s climate. This science tells us the historical global temperature changes preceded changes in carbon dioxide concentrations by many centuries on glacial cycle time scales.[vii],[viii],[ix],[x]
On multi-decade timescales the carbon dioxide concentration rise lags the temperature rise by many months.[xi] This means that global mean land surface, ocean surface, and stratospheric temperature changes precede changes in atmospheric carbon dioxide concentration (as Figure B indicates). One of these publications concludes that the elevated atmospheric carbon dioxide results from ocean degassing due to warmer oceans (plus human activity) consequent to increased solar activity.[xii]
Click on this page and download a free copy of my book “Revolution: Ice Age Re-Entry,” and read more about this topic in Chapters 4 and 1-2.
[i] Nicolaj K. Larsen et al., “The response of the southern Greenland ice sheet to the Holocene thermal maximum.” Geology ; 43 (4): 291–294. doi: https://doi.org/10.1130/G36476.1.
[ii] D.S. Kaufman et al., “Holocene thermal maximum in the western Arctic (0–1800W).” Quaternary Science Reviews 23 (2004) 529–560.
[iii] J.P. Briner et al., “Holocene climate change in Arctic Canada and Greenland.” Quaternary Science Reviews (2016), http://dx.doi.org/10.1016/j.quascirev.2016.02.010.
[iv] Highest temperature on record. IPCC, Climate Change 2007: The Physical Science Basis. Contribution of Working Group I to the Fourth Assessment Report of the Intergovernmental Panel on Climate Change [Solomon, S., D. Qin, M. Manning, Z. Chen, M. Marquis, K.B. Averyt, M. Tignor and H.L. Miller (eds.)]. Cambridge University Press, Cambridge, United Kingdom and New York, NY, USA, 996 pages [Exposé: See page 288. The IPCC tells us the 1998 global mean air temperature was the highest on record until 2005.].
[v] This 11-year solar cycle lag (approximate) is composed of 9 years (i.e., half of a 18-year moving average), plus a two year lag in the temperature rise (behind the Beryllium-10 rise), plus one year before the newly produced Beryllium-10 in the upper atmosphere reaches earth’s surface where it can be incorporated in ice cores (and thus be measured)(Beryllium-10 atmospheric residence time: R.C. Finkel and K. Nishiizumi, 1997, “Beryllium 10 concentrations in the Greenland Ice Sheet Project 2 ice core from 3–40 ka.” J. Geophys. Res., 102(C12), 26699–26706, doi: 10.1029/97JC01282).
[vi] Data: (1) A.M. Berggren et al., 2009, “A 600-year annual 10Be record from the NGRIP ice core, Greenland.” Geophysical Research Letters, 36, L11801, doi:10.1029/2009GL038004. National Centers for Environmental Information, NESDIS, NOAA, U.S. Department of Commerce. North GRIP – 600 Year Annual 10Be Data. https://www.ncdc.noaa.gov/paleo-search/study/8618. Downloaded 05/05/2018. (2) T. Kobashi et al., 2013, “Causes of Greenland temperature variability over the past 4000 years: implications for northern hemispheric temperature changes.” Climate of the Past, 9(5), 2299-2317. doi: 10.5194/cp-9-2299-2013. National Centers for Environmental Information, NESDIS, NOAA, U.S. Department of Commerce. Northern Hemisphere 4000 Year Temperature Reconstructions. https://www.ncdc.noaa.gov/paleo/study/15535. Downloaded 05/05/2018. (3) Etheridge, D.M., et al., 2001, “Law Dome Atmospheric CO2 Data,” IGBP PAGES/World Data Center for Paleoclimatology. Data Contribution Series #2001-083. NOAA/NGDC Paleoclimatology Program, Boulder CO, USA. https://www1.ncdc.noaa.gov/pub/data/paleo/icecore/antarctica/law/law2006.xls. Downloaded 28 August 2018. Personal Research: A 18-year moving average of the Beryllium-10 concentration anomaly (relative to the 1960-1986 average) and carbon dioxide concentration anomaly (relative to the 1961-1990 average) were rendered from the raw data and plotted against the Northern Hemisphere temperature anomaly (relative to the 1961-1990 average) to create Figures 4.3.A and B.]
[vii] Manfred Mudelsee, “The phase relations among atmospheric CO2 content, temperature and global ice volume over the past 420 ka.” Quaternary Science Reviews 20 (2001) 583-58.
[viii] Eric Monnin et al., “Atmospheric CO2 Concentrations over the Last Glacial Termination.” By Science 05 Jan 2001: 112-114.
[ix] N. Caillon et al., 2003, “Timing of atmospheric CO2 and Antarctic temperature changes across Termination III.” Science 299: 1728-1731.
[x] H. Fischer et al., 1999, “Ice core records of atmospheric CO2 around the last three glacial terminations.” Science, 283, 1712-1714.
[xi] Ole Humlum et al., “The phase relation between atmospheric carbon dioxide and global temperature.” Global and Planetary Change. Volume 100, January 2013, 51-69.
[xii] Ole Humlum et al., “The phase relation between atmospheric carbon dioxide and global temperature.” Global and Planetary Change. Volume 100, January 2013, 51-69.