World energy consumption by fuel type and sector
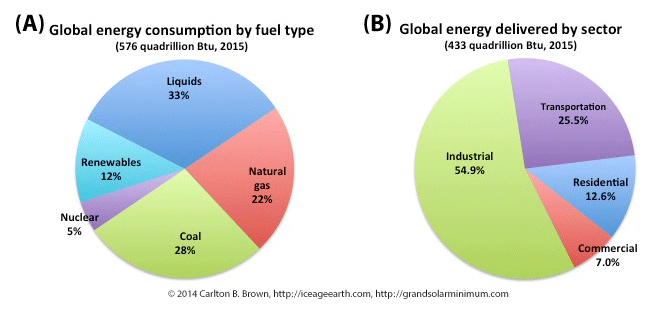
The world depends on non-renewable fossil and nuclear fuels for its primary sources of energy. Fossil fuels supply 83 percent of the world’s energy needs. More than 90 percent of energy consumption is accounted for by industrial, transportation, and residential use.[i]
The level and mix of energy use varies by sector and by country, depending on their stage of economic and technological development.[ii] At the macro level, liquid fuels, natural gas, and coal supply over 80 percent of energy consumed, with nuclear fuel and renewable energy accounting for the balance, as indicated in the figure above.
The global energy market consumes its supply of energy across the industrial, transportation, residential, and commercial sectors. Industrial use and transportation account for 80 percent of the energy consumed globally, making these two sectors important for a switch to renewable energy and the realization of fossil fuel savings.[iii]
Keys actions for the industrial sector to improve its energy efficiency and switch energy systems
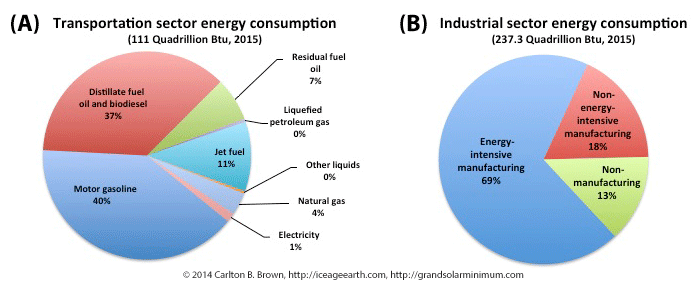
The industrial sector is the largest global user of energy, consuming more than half of the energy supplied across all sectors. Heat and energy-intensive manufacturing processes consume most of this energy. This energy is used in the manufacture of food, steel and other metals, chemicals, in oil refining, and in pulp and paper production.
Principle areas for industrial action would include switching manufacturing processes to renewable energy for low temperature heating and cooling processes, and for fluid heating and steam generation processes. Switching to renewable energy systems for powering lighting and air temperature control systems inside buildings will also lead to significant fossil fuel savings.[iv]
Where heat is generated in industrial and manufacturing processes, energy recovery systems should be utilized to harness the dissipated or waste heat to improve overall energy efficiency.
Keys actions for the transport sector to improve its energy efficiency and switch energy systems
Figure A) Liquid fuels account for 95 percent of all fuels used in transportation, while natural gas and electricity account for the rest. B) Industry is the largest user of fossil fuel energy supplies, with energy-intensive manufacturing processes accounting for nearly 70 percent of industry’s total energy use.[v]
The transportation sector is the second-largest user of energy. More than half of the energy used by the transportation sector is in nations belonging to the Organization for Economic Co-operation and Development (OECD).[vi],[vii] However transportation in non-OECD nations is expected to dominate future growth in fuel use.[viii]
Passenger transportation accounts for nearly two-thirds of transportation fuel use, and freight transport for just over one-third. Light duty passenger transportation, air transportation, freight trucks, and shipping are the main users of energy within the transportation sector.[ix] All of these means of transport must come under scrutiny designed to find ways to improve their fuel use and efficiency. Reducing energy use and improving energy efficiency will require a general downsizing of engine capacities and reductions in vehicle weights.
Switching transportation to renewable energy systems is a priority, especially for passenger and freight transportation, as well as in cities and on the main intercity routes where most traffic occurs. The two main options for switching the transport sector to renewable energy sources are reviewed on another page.
[i] Data: International Energy Outlook 2017. Release Date: September 14, 2017, Report Number: DOE/EIA-0484(2017). Data extracted from. Table F1. Total world delivered energy consumption by end-use sector and fuel, Reference case, 2015-50. https://www.eia.gov/outlooks/ieo/excel/appf_tables.xlsx. Downloaded 06/04/2018.
[ii] U.S. Energy Information Administration (EIA). International Energy Outlook 2017. Release Date: September 14, 2017. Report Number: DOE/EIA-0484(2017). https://www.eia.gov/outlooks/ieo/pdf/industrial.pdf.
[iii] U.S. Energy Information Administration (EIA), Annual Energy Outlook 2017, DOE/EIA-0383(2017) (Washington, DC: January 2017). Data used; https://www.eia.gov/outlooks/ieo/excel/appf_tables.xlsx.
[iv] U.S. Energy Information Administration (EIA). International Energy Outlook 2017. Release Date: September 14, 2017. Report Number: DOE/EIA-0484(2017). https://www.eia.gov/outlooks/ieo/pdf/industrial.pdf.
[v] Data: Report: International Energy Outlook 2017. Release Date: September 14, 2017, Report Number: DOE/EIA-0484(2017). (1) Figure 9.3.A: Data extracted from. Table L1. Transportation sector energy consumption by region and fuel, Reference case, 2015-50. https://www.eia.gov/outlooks/ieo/excel/appl_tables.xlsx. Downloaded 06/04/2018. (2) Figure 9.3.B: Data extracted from. Table K1. Industrial sector energy consumption by region and sector, Reference case, 2015-50. https://www.eia.gov/outlooks/ieo/excel/appk_tables.xlsx. Downloaded 06/04/2018.
[vi] List of OECD Member countries – Ratification of the Convention on the OECD. http://www.oecd.org/about/membersandpartners/list-oecd-member-countries.htm.
[vii] U.S. Energy Information Administration (EIA). International Energy Outlook 2017. Release Date: September 14, 2017, Report Number: DOE/EIA-0484(2017). Data adapted from https://www.eia.gov/outlooks/ieo/excel/appl_tables.xlsx. Accessed 06/04/2018.
[viii] U.S. Energy Information Administration. Transportation sector energy consumption. Overview. International Energy Outlook 2016. https://www.eia.gov/outlooks/ieo/pdf/transportation.pdf. [See Overview on page 1 of 11 of Chapter 8].
[ix] U.S. Energy Information Administration. Transportation sector energy consumption. Overview. International Energy Outlook 2016. https://www.eia.gov/outlooks/ieo/pdf/transportation.pdf. [See Overview on page 4 and 5 of 11 of Chapter 8].


Recent Comments