Earth entered a new ice age after the Holocene Climate Optimum

Earth entered a new ice age after the Holocene Climate Optimum

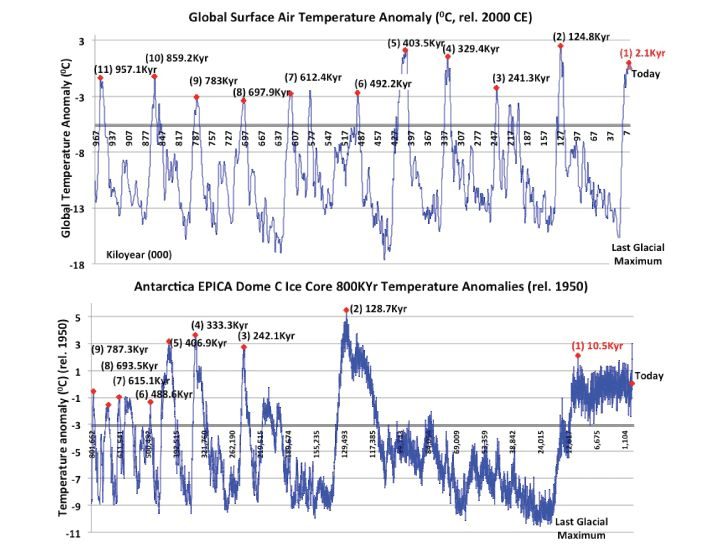
Polar and global climate optima, or peak glacial cycle temperatures (red dots), are specifically phased. In general, Antarctica’s climate optimum is reached before the Arctic’s, which is reached before the global climate optimum.

A number of datasets were used to understand glacial cycle temperature changes, their relative phasings, and what stage of the glacial cycle we occupy today. The reconstructed temperature data analyzed spans of 3,000,000 years (global),[1] 800,000 years (Antarctica Dome EPICA C),[2] 360,000 years (Antarctica Dome Fuji),[3] 248,000 years (Greenland Oxygen-18 isotope),[4] and 11,700 years[5] and 49,000 years[6] (Greenland). These provide an informative panorama of the earth’s changing climate and its historical glacial cycles. Antarctica’s Dome EPICA C and the global climate data are graphically displayed above.

The Holocene Climate Optimum was reached 10,500 years ago in Antarctica (Dome-C data), 8,000 years ago in the Arctic (Greenland data),[7] and 2,100 years ago globally, yielding a phasing gap of 8,400 years. This 8,400-year phasing gap is the longest in the last 800,000 years of glacial cycles, meaning the global climate optimum 2,100 years ago was already late.

Likewise, the interval between the Holocene Climate Optimum and its preceding climate optimum was the longest recorded interval in 800,000 years in Antarctic (a 121,800 year interval) and 2 million years globally (a 122,700 year interval). [8]

Based on the above-cited climate optima phasing gaps and climate optimum intervals, there is no justification for the Intergovernmental Panel on Climate Change (IPCC) proposing that the ice age lies 30,000 years ahead of us (see below). There is even less justification for thinking the ice age lies ahead of us today when you realize there is more polar ice present now than there was at the Holocene Climate Optimum (see link).

This means that the climate optima temperature peaks for Antarctica 10,500 years ago, Greenland 8,000 years ago, and globally 2,100 years ago, represented the end of the previous interglacial period. Based on the above graphics you can see that ice ages start after the climate optimum, as the temperatures begin to decline (from peak to right). The conclusion therefore is that this Ice Age started 8,000 and 10,500 years ago in the north and south poles respectively, and 2,100 years ago globally.

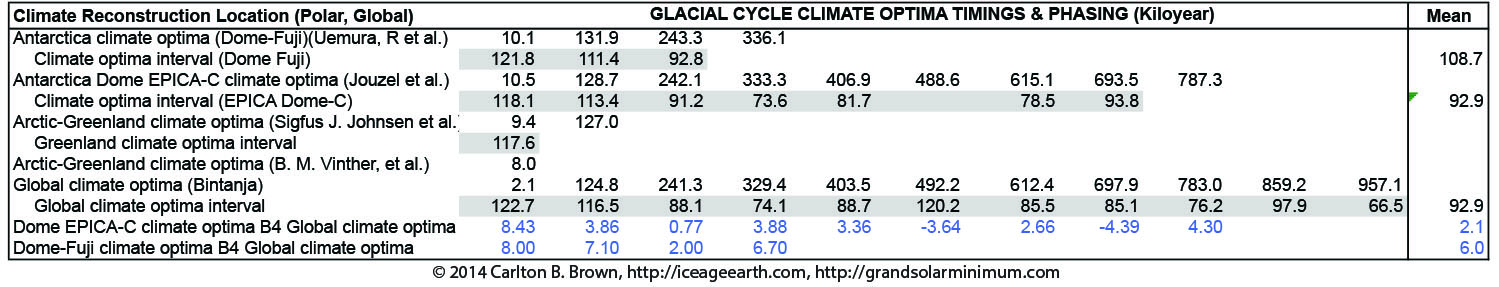
Key data was extracted and tabulated (see above) to summarize the climate optima dates, the inter-climate optimum intervals, and the phasing gaps between the Antarctic and global climate optima for each glacial cycle.

The IPCC’s 30,000-Year Ice Age Deferral Is Statistically Falsifiable

There are crucially important statistical implications relating to the IPCC’s theory for delaying the next ice age by 30,000 years.[9],[10] The statistical implications have been ignored (I am assuming), and would automatically lead to the dismissal of this theoretical ice age delay. The statistical implications relate to how this delay adjusts the interval back to the previous ice age, the interglacial period duration, and the relative phasing gap between the Antarctic and global climate optima, when compared with all previous glacial cycles in the last 800,000 (Antarctica) and 2,000,000 (global) years.[11],[12]

By extending the start of the ice age another 30,000 years from its “real start” 2,100 years ago (global data), the interglacial period duration is extended. The last interglacial period started 19,600 years ago and ended 2,100 years ago at the Holocene Climate Optimum. Consequently, the interglacial period would increase from its existing 17,500 years to 49,600 years, rendering the revised 49,600-year interglacial period duration a statistically significant outlier (see the data table summary embedded in the citation).[13]

Similarly, by ignoring the global climate optimum 2,100 years ago and extending the interglacial period by another 30,000 years, one would be positing a new Holocene Climate Optimum 30,000 years in the future. Creating a new Holocene Climate Optimum would extend the already longest interval, going back to the previous climate optimum, from 122,700 years to 154,800 years.

Compared with all thirty-two preceding climate optima intervals in the last 2,026,800 years, this revised 154,800-year interval would become a statistically significant outlier. The original non-delayed climate optimum interval, while an outlier, was not a statistically significant one (See the data in the following citation).[14]

In the third statistical analysis, the timings for the last nine glacial cycle climate optima in Antarctica were compared with their corresponding global climate optima timings, to determine the phasing gap for each glacial cycle. In all but two glacial cycles, the climate optimum was reached first in Antarctica, and on average 2,100 years before it was reached globally. The global climate optimum 2,100 years ago already had the longest phasing gap with its corresponding Antarctic climate optimum, compared with all previous Antarctic and global phasing gaps in the past 800,000 years.

By delaying the Holocene Climate Optima 30,000 years, the phasing gap between Antarctica EPICA Dome-C (10,500 years ago) and the global (2,100 years ago) data changes from 8,400 years to 40,500 years, rendering this revised phasing gap a statistically significant outlier (See the data in the following citation).[15]

Delaying an ice age by 30,000 years cannot be statistically justified on at least three counts. By delaying the ice age 30,000 years a statistical outlier is created for interglacial durations, inter-climate optima intervals, and Antarctic-to-global climate optima phasing gaps (P-value <0.05 in all three of the above cited cases). In addition, by delaying the ice age another 30,000 years, the distribution of the data is changed from a normal distribution to a non-normal distribution profile. If normal science were operating in an unimpinged manner, it would emphatically reject the IPCC’s 30,000-year delay to the start of the next ice age.


[1]      Bintanja, R. and R.S.W. van de Wal, “North American ice-sheet dynamics and the onset of 100,000-year glacial cycles.” Nature, Volume 454, 869-872, 14 August 2008. doi:10.1038/nature07158. National Centers for Environmental Information, NESDIS, NOAA, U.S. Department of Commerce. Global 3Ma Temperature, Sea Level, and Ice Volume Reconstructions. https://www.ncdc.noaa.gov/paleo-search/study/11933. Downloaded 10/27/2015.

[2]      J.V. Jouzel et al., 2007, “Orbital and Millennial Antarctic Climate Variability over the Past 800,000 Years.” Science, Volume 317, No. 5839, 793-797, 10 August 2007. National Centers for Environmental Information, NESDIS, NOAA, U.S. Department of Commerce. EPICA Dome C – 800KYr Deuterium Data and Temperature Estimates. https://www.ncdc.noaa.gov/paleo/study/6080. Download data: Downloaded 08/02/2016.

[3]      R.V. Uemura et al., 2012, “Ranges of moisture-source temperature estimated from Antarctic ice cores stable isotope records over glacial-interglacial cycles.” Climate of the Past, 8, 1109-1125. doi: 10.5194/cp-8-1109-2012. National Centers for Environmental Information, NESDIS, NOAA, U.S. Department of Commerce. Dome Fuji 360KYr Stable Isotope Data and Temperature Reconstruction. https://www.ncdc.noaa.gov/paleo-search/study/13121. Downloaded 05/05/2018.

[4]      Sigfus J. Johnsen et al., 1997, “The d18O record along the Greenland Ice Core Project deep ice core and the problem of possible Eemian climatic instability.” Journal of Geophysical Research: Oceans, 102(C12), 26397-26410. doi: 10.1029/97JC00167. National Centers for Environmental Information, NESDIS, NOAA, U.S. Department of Commerce. GRIP Ice Core 248KYr Oxygen Isotope Data. https://www.ncdc.noaa.gov/paleo-search/study/17839.

[5]      B.M. Vinther et al., 2009, “Holocene thinning of the Greenland ice sheet.” Nature, Vol. 461, pp. 385-388, 17 September 2009. National Centers for Environmental Information, NESDIS, NOAA, U.S. Department of Commerce. Greenland Ice Sheet Holocene d18O, Temperature, and Surface Elevation. doi:10.1038/nature08355. https://www.ncdc.noaa.gov/paleo-search/study/11148. Downloaded 05/05/2018.

[6]      R.B. Alley, 2004, “GISP2 Ice Core Temperature and Accumulation Data.” National Centers for Environmental Information, NESDIS, NOAA, U.S. Department of Commerce. https://www.ncdc.noaa.gov/paleo/study/2475. Downloaded 05/05/2018.

[7]      B.M. Vinther et al., 2009, “Holocene thinning of the Greenland ice sheet.” Nature, Vol. 461, pp. 385-388, 17 September 2009. National Centers for Environmental Information, NESDIS, NOAA, U.S. Department of Commerce. Greenland Ice Sheet Holocene d18O, Temperature, and Surface Elevation. doi:10.1038/nature08355. https://www.ncdc.noaa.gov/paleo-search/study/11148. Downloaded 05/05/2018.

[8]      Data: (1) J.V. Jouzel et al., 2007, “Orbital and Millennial Antarctic Climate Variability over the Past 800,000 Years.” Science, Volume 317, No. 5839, 793-797, 10 August 2007. National Centers for Environmental Information, NESDIS, NOAA, U.S. Department of Commerce. EPICA Dome C – 800KYr Deuterium Data and Temperature Estimates. https://www.ncdc.noaa.gov/paleo/study/6080. Download data: Downloaded 08/02/2016. (2) Bintanja, R. and R.S.W. van de Wal, “North American ice-sheet dynamics and the onset of 100,000-year glacial cycles.” Nature, Volume 454, 869-872, 14 August 2008. doi:10.1038/nature07158. National Centers for Environmental Information, NESDIS, NOAA, U.S. Department of Commerce. Global 3Ma Temperature, Sea Level, and Ice Volume Reconstructions. https://www.ncdc.noaa.gov/paleo-search/study/11933. Downloaded 10/27/2015. (3) R.V. Uemura et al., 2012, “Ranges of moisture-source temperature estimated from Antarctic ice cores stable isotope records over glacial-interglacial cycles.” Climate of the Past, 8, 1109-1125. doi: 10.5194/cp-8-1109-2012. National Centers for Environmental Information, NESDIS, NOAA, U.S. Department of Commerce. Dome Fuji 360KYr Stable Isotope Data and Temperature Reconstruction. https://www.ncdc.noaa.gov/paleo-search/study/13121. Downloaded 05/05/2018. Personal Research: Based on the above-cited climate data the climate optima timings and inter-climate optima intervals were tabulated using the Dome Fuji, EPICA Dome-C, and Greenland ice core data. This table (at the start of the endnotes, referencing this endnote) also details 787,300 years of Antarctic-to-global climate optima phasing gaps (Kiloyears) for both EPICA Dome-C and Dome-Fuji.

[9]      IPCC Working Group 1 (AR4) deferred the ice age 30,000 years without peer review: IPCC, Climate Change 2007: The Physical Science Basis. Contribution of Working Group I to the Fourth Assessment Report of the Intergovernmental Panel on Climate Change [Solomon, S., D. Qin, M. Manning, Z. Chen, M. Marquis, K.B. Averyt, M. Tignor and H.L. Miller (eds.)]. Cambridge University Press, Cambridge, United Kingdom and New York, NY, USA, 996 pages [Exposé: See page 56, Box TS.6. “The Milankovitch, or ‘orbital’ theory of the ice ages is now well developed. Ice ages are generally triggered by minima in high-latitude NH summer insolation, enabling winter snowfall to persist through the year and therefore accumulate to build NH glacial ice sheets.” Followed by, “Available evidence indicates that the current warming will not be mitigated by a natural cooling trend towards glacial conditions. Understanding of the Earth’s response to orbital forcing indicates that the Earth would not naturally enter another ice age for at least 30,000 years. {6.4, FAQ 6.1}.” See page 85 section TS.6.2.4 Paleoclimate under “Robust Findings” “It is very unlikely that the Earth would naturally enter another ice age for at least 30,000 years. {6.4}”). Critique: There is a statistical consequence in delaying the ice age by 30,000-years because this delay impacts the interglacial period duration, the inter-climate optimum interval, and global-to-Antarctica climate optimum phasing gaps relative to all other glacial cycles for the global (2 million years), Antarctic (800,000 years) and Arctic (248,000 years) climate data. This ice age delay hypothesis is being passed off as though it is a scientific fact, when in reality it is an unproven, non-peer reviewed, and readily falsifiable hypothesis (see Revolution, Chapters 2-4).].

[10]    IPCC Working Group 1 (AR5) deferred the ice age 30,000 years without peer review: IPCC, 2013: Climate Change 2013: The Physical Science Basis. Contribution of Working Group I to the Fifth Assessment Report of the Intergovernmental Panel on Climate Change [Stocker, T.F., D. Qin, G.-K. Plattner, M. Tignor, S.K. Allen, J. Boschung, A. Nauels, Y. Xia, V. Bex and P.M. Midgley (eds.)]. Cambridge University Press, Cambridge, United Kingdom and New York, NY, USA, 1535 pages. [Exposé; See Page 70, “It is virtually certain that orbital forcing will be unable to trigger widespread glaciation during the next 1000 years. Paleoclimate records indicate that, for orbital configurations close to the present one, glacial inceptions only occurred for atmospheric CO2 concentrations significantly lower than pre-industrial levels. Climate models simulate no glacial inception during the next 50,000 years if CO2 concentrations remain above 300 ppm. {5.8.3, Box 6.2}.” Given the IPCC legacy of forecasting failure this non-peer reviewed assumption should be treated with serious caution.].

[11]    Bintanja, R. and R.S.W. van de Wal, “North American ice-sheet dynamics and the onset of 100,000-year glacial cycles.” Nature, Volume 454, 869-872, 14 August 2008. doi:10.1038/nature07158. National Centers for Environmental Information, NESDIS, NOAA, U.S. Department of Commerce. Global 3Ma Temperature, Sea Level, and Ice Volume Reconstructions. https://www.ncdc.noaa.gov/paleo-search/study/11933. Downloaded 10/27/2015.

[12]    J. V. Jouzel et al., 2007, “Orbital and Millennial Antarctic Climate Variability over the Past 800,000 Years.” Science, Volume 317, No. 5839, 793-797, 10 August 2007. National Centers for Environmental Information, NESDIS, NOAA, U.S. Department of Commerce. EPICA Dome C – 800KYr Deuterium Data and Temperature Estimates. https://www.ncdc.noaa.gov/paleo/study/6080. Download data: Downloaded 08/02/2016.

[13]    Data: Bintanja, R. and R.S.W. van de Wal, “North American ice-sheet dynamics and the onset of 100,000-year glacial cycles.” Nature, Volume 454, 869-872, 14 August 2008. doi:10.1038/nature07158. National Centers for Environmental Information, NESDIS, NOAA, U.S. Department of Commerce. Global 3Ma Temperature, Sea Level, and Ice Volume Reconstructions. https://www.ncdc.noaa.gov/paleo-search/study/11933. Downloaded 10/27/2015. Personal Research: The following table was created to summarize 965,300 years of global interglacial periods (Kiloyears). A Grubb’s test (extreme studentized deviate) was performed to determine if the IPCC’s proposed 30,000-year extension to the Holocene interglacial period created a statistically significant outlier in this group of eleven glacial cycle comparators. To test the statistical validity, the current interglacial duration of 17,500 years was extended by 30,000, plus 2,100 years from its existing climate optimum peak to bring it up to today, yielding a revised 49,600 year interglacial period. By extending this current interglacial by 30,000 years the group interglacial duration mean was 21.1Kyr, standard deviation 11.2Kyr, N=11, and an outlier was detected (two-sided P<0.05). The critical value of Z = 2.35. A goodness of fit test was performed with the original data using the d’Agostino-Pearson test: P = 0.386, indicating the original group was not different from a Gaussian or normal distribution. On this basis the Grubbs test was selected to test for an outlier. By delaying the Holocene 30,000 years the interglacial period was extended to 49,600 years and the d’Agostino-Pearson test: P = 0.011. This 30,000 year interglacial extension changed the data-population distribution to a non-normal or non-Gaussian distribution. This change in data distribution adds further support that the 30,000-year delay can not be statistically justified.

[14]    Data: Bintanja, R. and R.S.W. van de Wal, “North American ice-sheet dynamics and the onset of 100,000-year glacial cycles.” Nature, Volume 454, 869-872, 14 August 2008. doi:10.1038/nature07158. National Centers for Environmental Information, NESDIS, NOAA, U.S. Department of Commerce. Global 3Ma Temperature, Sea Level, and Ice Volume Reconstructions. https://www.ncdc.noaa.gov/paleo-search/study/11933. Downloaded 10/27/2015. Personal Research: The following table data summary was created detailing 2,026,800 years of global climate optima timings and intervals (from peak-to-peak; Kiloyears). Without any change to the 2.1Kyr climate optimum 2,100 years ago i.e., without a 30,000-year extension to the Holocene interglacial period, the current largest climate optimum interval of 122.7 kiloyears (2.1-124.8Kyr peak) is not a statistically significant outlier (P>0.05) compared with the comparator group (N=33). However, when this interglacial period is extended 30,000 years the revised climate optima interval (154.8 kiloyears) becomes a statistically significant outlier (P<0.05). For the revised dataset (with 30,000-year extension): the Mean = 62.3, standard deviation = 30.2, N = 33. Outlier detected? Yes. Significance level: 0.05 (two-sided). Critical value of Z: 2.95. A goodness of fit was pre-assessed for the original unmodified data (i.e., no 30Kyr delay) using the d’Agostino-Pearson test: P = 0.095. On this basis the Grubb’s outlier test was selected because the original data was normally distributed. When the 122.7Kyr climate optimum interval was substituted with the 154.8Kyr data point the d’Agostino-Pearson test: P = 0.011. This 30,000-year modification changed the data-population distribution to a non-normal distribution. This change in data distribution adds further support that the 30,000-year delay can not be statistically justified.

[15]    Data: (1) Jouzel, J., V. et al. 2007. “Orbital and Millennial Antarctic Climate Variability over the Past 800,000 Years.” Science, Volume 317, No. 5839, 793-797, 10 August 2007. National Centers for Environmental Information, NESDIS, NOAA, U.S. Department of Commerce. EPICA Dome C – 800KYr Deuterium Data and Temperature Estimates. https://www.ncdc.noaa.gov/paleo/study/6080. Download data: Downloaded 08/02/2016. (2) R. Bintanja and R.S.W. van de Wal, North American ice-sheet dynamics and the onset of 100,000-year glacial cycles. Nature, Volume 454, 869-872, 14 August 2008. doi:10.1038/nature07158. National Centers for Environmental Information, NESDIS, NOAA, U.S. Department of Commerce. Global 3Ma Temperature, Sea Level, and Ice Volume Reconstructions. https://www.ncdc.noaa.gov/paleo-search/study/11933. Downloaded 10/27/2015. Personal Research: The data is tabulated above (at the start of the endnotes, referencing this endnote). detailing 787,300 years of Antarctic-to-global climate optima phasing gaps (Kiloyears). A Grubb’s test (extreme studentized deviate) was performed on the Antarctic-to-global climate optima phasing gaps to determine if the IPCC’s proposed 30,000 year ice age delay created a statistically significant outlier from the other 8 glacial cycle comparator phasing gaps (Antarctica versus global; glacial cycles 1-9). By delaying the Holocene Climate Optima 30,000 years, the phasing gap changes from the current 8,400 years to a statistically significant 40,500 years (P<0.05)(40,500 years =30,000+2,100+8,400 years). The 30,000-year phasing gap increase was only applied to the global climate data’s climate optimum because Antarctica’s climate optimum was set in the ice record 10,500 years ago and new ice has accumulated since, indicating its ice age has already started (i.e., the inner dome is 100 meters higher today than it was at the Holocene Climate Optimum, see Chapter 3). A goodness of fit test was performed with the original data using the d’Agostino-Pearson test: P = 0.678, indicating the original group was not different from a Gaussian or normal distribution. On this basis the Grubbs test was selected to test for an outlier. By delaying the Holocene 30,000 years the phasing gap was increased to 40,500 years and the d’Agostino-Pearson test: P< 0.001. This 30,000-year interglacial extension changed the data-population distribution from a normal to a non-normal distribution. This change in data distribution adds further support that the 30,000-year delay can not be statistically justified.

The Last Ice Age Ended 20,000–24,000 Years Ago, Not 11,700 Years Ago

The Last Ice Age Ended 20,000–24,000 Years Ago, Not 11,700 Years Ago

We are told by science and in our schools that the last ice age (glacial period) ended 11,700 years ago, after which the Holocene interglacial began. However, the reality is this timing actually coincided with the end of the Younger Dryas, or a period that represented the worst rapid climate change event since the last glacial maximum 19,600 years ago (global data).

Figure legend: Reconstructed global,[i] Antarctic,[ii] and Arctic[iii] glacial cycle temperatures from the last glacial maximum or end of the last ice age (lowest temperature, red diamond shape) to just past the climate optimum at the end of the interglacial period (highest temperature) delineate three points of reference i.e., the last glacial maximum, the end of the Younger Dryas 11,700 years ago, and the Holocene Climate Optimum (red triangle shape). The glacial maxima and the climate optima are at either end of the interglacial period. The supposed end of the last ice age 11,700 years ago (11.7 kiloyear) is marked above. If the ice age ended 11,700 years ago then the 11.7 kiloyear marker should be close to the glacial maximum marker at the bottom of the graphics, but this is not the case.

Prior to the end of the Younger Dryas 11,700 years ago, and within the space of a few decades, the temperature in the Arctic dropped by about nine degrees Celsius.[i] The temperature did not recover for another three hundred years. During this time the Arctic ice sheets advanced and the most pronounced fauna extinctions of the Holocene interglacial took place, including dozens of mammalian and avian species.[ii],[iii]

Climate data reconstructions show that the lowest temperature at the last glacial maximum in Greenland (GISP2 ice core)[iv] occurred 24,098 years ago, in Antarctica at Dome Fuji 19,300 years ago,[v] and globally the lowest temperature occurred 19,600 years ago.[vi] The Antarctica Dome-C[vii] and Greenland Ice Core Project (GRIP)[viii] climate data reveal similar glacial maximum and climate optimum timelines to those displayed in the figure above. The correct date for the last glacial maximum (i.e., end of the last ice age) can be seen in the figure above relative to the 11,700-year date for the end of the Younger Dryas.

By the end of the Younger Dryas 11,700 years ago, when the current Holocene interglacial had “officially” started (as we are told), nearly two-thirds of the Holocene’s total sea level rise, and three-quarters of the Holocene’s total temperature rise had already taken place (see table summary in the citation).[ix] Therefore, equating the end of the Younger Dryas with the end of the last ice age means we are in error as to the correct stage of the glacial cycle that we are in now.


[i]       A.E. Carlson, 2013, “The Younger Dryas Climate Event.” In: Elias S.A. (ed.) The Encyclopedia of Quaternary Science, Volume 3, 126-134. Amsterdam: Elsevier. http://people.oregonstate.edu/~carlsand/carlson_encyclopedia_Quat_2013_YD.pdf.

[ii]      Anthony D. Barnosky et al., “Approaching a state shift in Earth’s biosphere.” Nature Volume 486, 52–58 (07 June 2012). doi:10.1038/nature11018.                    .

[iii]     R. B. Firestone et al., “Evidence for an extraterrestrial impact 12,900 years ago that contributed to the megafaunal extinctions and the Younger Dryas cooling.” PNAS October 9, 2007. 104 (41) 16016-16021; https://doi.org/10.1073/pnas.0706977104.

[iv]     R.B. Alley, 2004, “GISP2 Ice Core Temperature and Accumulation Data.” National Centers for Environmental Information, NESDIS, NOAA, U.S. Department of Commerce. https://www.ncdc.noaa.gov/paleo/study/2475. Downloaded 05/05/2018.

[v]      R.V. Uemura et al., 2012, “Ranges of moisture-source temperature estimated from Antarctic ice cores stable isotope records over glacial-interglacial cycles.” Climate of the Past, 8, 1109-1125. doi: 10.5194/cp-8-1109-2012. National Centers for Environmental Information, NESDIS, NOAA, U.S. Department of Commerce. Dome Fuji 360KYr Stable Isotope Data and Temperature Reconstruction. https://www.ncdc.noaa.gov/paleo-search/study/13121. Downloaded 05/05/2018.

[vi]     Bintanja, R. and R.S.W. van de Wal, “North American ice-sheet dynamics and the onset of 100,000-year glacial cycles.” Nature, Volume 454, 869-872, 14 August 2008. doi:10.1038/nature07158. National Centers for Environmental Information, NESDIS, NOAA, U.S. Department of Commerce. Global 3Ma Temperature, Sea Level, and Ice Volume Reconstructions. https://www.ncdc.noaa.gov/paleo-search/study/11933. Downloaded 10/27/2015.

[vii]    J. V. Jouzel et al., 2007, “Orbital and Millennial Antarctic Climate Variability over the Past 800,000 Years.” Science, Volume 317, No. 5839, 793-797, 10 August 2007. National Centers for Environmental Information, NESDIS, NOAA, U.S. Department of Commerce. EPICA Dome C – 800KYr Deuterium Data and Temperature Estimates. https://www.ncdc.noaa.gov/paleo/study/6080. Download data: Downloaded 08/02/2016.

[viii]   Sigfus J. Johnsen et al., 1997, “The d18O record along the Greenland Ice Core Project deep ice core and the problem of possible Eemian climatic instability.” Journal of Geophysical Research: Oceans, 102(C12), 26397-26410. doi: 10.1029/97JC00167. National Centers for Environmental Information, NESDIS, NOAA, U.S. Department of Commerce. GRIP Ice Core 248KYr Oxygen Isotope Data. https://www.ncdc.noaa.gov/paleo-search/study/17839.

[ix]     Data: R. Bintanja and R.S.W. van de Wal, “North American ice-sheet dynamics and the onset of 100,000-year glacial cycles.” Nature, Volume 454, 869-872, 14 August 2008. doi:10.1038/nature07158. National Centers for Environmental Information, NESDIS, NOAA, U.S. Department of Commerce. Global 3Ma Temperature, Sea Level, and Ice Volume Reconstructions. https://www.ncdc.noaa.gov/paleo-search/study/11933. Downloaded 10/27/2015. Personal Research: Using the above-cited file, the temperature and sea level data were extracted; from the Last glacial maximum 19,600 years ago to the Holocene Climate Optimum (2,100 years ago). The Younger Dryas 11,700 years ago was included to help us see that the last ice age did not end 11,700 years ago. Results: by 11,700 years ago the sea level had already risen 64% and the temperature 76% of their total Holocene interglacial rise (from glacial maximum to climate optimum). This confirms the last ice age did not end 11,700 years ago, but rather it was the Younger Dryas that ended. The data very clearly tells us the last ice age ended 19,600 years ago, after which the sea level began to rise and the ice mass decrease.].

A new ice age was entered after the Arctic Holocene Climate Optimum

A new ice age was entered after the Arctic Holocene Climate Optimum

The Arctic entered the new ice age after the Holocene Climate Optimum 8,000 years ago. Between 6000 BCE and 1700 CE the Arctic temperature declined 5deg.C before entering the most extreme global warming phase from 1700-2016. This decline in Arctic temperature since the climate optimum paralleled a 40-50 Watt/m2 decline in total solar irradiance, and a large ice build up to the mid-19th century. To give perspective to today’s global mean surface temperature we must look beyond 1880, back to the Holocene Climate Optimum and preceding glacial cycles, and look at the polar ice core climate reconstructions. Otherwise, we are susceptible to manipulation by those wielding the global mean surface temperature since 1880 and telling us its the hottest on record.

A graphic of Greenland’s ice core climate reconstruction from 9080 BCE (after the Younger Dryas) to 1960 CE is positioned alongside a 20-year moving average of the Northern Hemisphere temperature anomaly (1870 to 2018; right hand diagram).[i] This depicts how the modern instrument era-derived Northern Hemisphere temperature data relates to Greenland’s ice core temperature data. This juxtaposition of different climate data was done to give an approximate bearing on today’s climate relative to the climate optimum.

Greenland’s ice temperature actually declined by 4.860C between the Holocene Climate Optimum in 5980 BCE (peak temperature) and 1700 CE, or about one-fifth of the Arctic’s interglacial temperature rise.[ii] This decline in Arctic temperature parallels a 40-50 Watts/m2 decline in solar irradiance, since the climate optimum and due to changes in earth’s orbit (inducing a precession of the summer solstice).[iii],[iv],[v],[vi] This decline in solar irradiance is some 15 times the theoretical radiative forcing impact of today’s greenhouse gas emissions,[vii] and gives perspective to human greenhouse gas emissions.

From 1700-1940 the Arctic climate entered a centennial-scale warming phase (an oscillation) with the temperature rising 2.870C. This was the most extreme temperature rise of 39 warming phases over the last 8,000 years,[viii] and yet rose still further between 1940 and 2016. By comparing today’s temperature with only that in 1880 we are being misled to believe that a 1.020C rise in temperature since 1880 is the highest on record.[ix] However, when today’s temperature is compared with the Holocene Climate Optimum’s temperature 7,980 years ago, then that highest rise in temperature on record actually represents a decline of 20C. Moving beyond the above data, the Arctic is generally recognized to be 2-40C lower in temperature than at the Holocene Climate Optimum.[x],[xi],[xii]

The Arctic ice core data emphatically tells us that we have already entered an ice age 8,000 years ago, and entered a global warming phase between 1700 and 2016 (which has putatively come to an end in 2016).

Click on this page and download a free copy of my book “Revolution: Ice Age Re-Entry,” and read more about this topic in Chapter 4.


[i]       Data: (1) B.M. Vinther et al., 2009, “Holocene thinning of the Greenland ice sheet.” Nature, Vol. 461, pp. 385-388, 17 September 2009. National Centers for Environmental Information, NESDIS, NOAA, U.S. Department of Commerce. Greenland Ice Sheet Holocene d18O, Temperature, and Surface Elevation. doi:10.1038/nature08355. https://www.ncdc.noaa.gov/paleo-search/study/11148. Downloaded 05/05/2018. (2) HadCRUT4 near surface temperature data set for the Northern Hemisphere. http://www.metoffice.gov.uk/hadobs/hadcrut4/data/current/download.html. Downloaded 25 July 2018.

[ii]      R.B. Alley, 2004, “GISP2 Ice Core Temperature and Accumulation Data.” National Centers for Environmental Information, NESDIS, NOAA, U.S. Department of Commerce. https://www.ncdc.noaa.gov/paleo/study/2475. Downloaded 5/5/2018. [Last Glacial Maximum’s deepest temperature trough was 24,098 years ago (-530C) and the Holocene Climate Optimum was 7,800 years ago (-28.860C). The difference between these time points is 16,297 years and 24.560C.]

[iii]     H. Wanner et al., “Structure and origin of Holocene cold events.” Quaternary Science Reviews (2011), doi:10.1016/j.quascirev.2011.07.010. [Comment: See Figure 5a, page 9, depicting the steady decline in Northern Hemisphere summer solar insolation at north 15 and 65 degree latitudes, and indicating that insolation has declined by 40 W/m2. This is based on the landmark research by Berger, 1978 (André Berger, Long-Term Variations of Daily Insolation and Quaternary Climatic Changes. 1978. Journal of the Atmospheric Sciences 35(12):2362-2367. DOI: 10.1175/1520-0469(1978)035<2362:LTVODI>2.0.CO;2).].

[iv]     D.S. Kaufman et al., “Holocene thermal maximum in the western Arctic (0–180°W).” Quaternary Science Reviews, Volume 23, Issues 5–6, 2004, 529-560. https://doi.org/10.1016/j.quascirev.2003.09.007. [Comment: See the abstract. We are told that the precession-driven summer insolation anomaly peaked 12,000-10,000 years ago. See also Figure 9a which depicts the 65°N insolation anomaly at different times of the year, indicating an approximate 50 Wm-2 decline in summer solstice insolation from its peak 12,000-10,000 years ago.].

[v]      Darrell Kaufman et al., “Recent Warming Reverses Long-Term Arctic Cooling.” September 2009. Science 325(5945):1236-1239. DOI: 10.1126/science.1173983. [Comment: This publication details the Arctic cooling that has been in progress for the last 2,000 years until this recent global warming phase. This millennial-scale cooling trend correlates (r = +0.87 with a R-squared 0.76, see Figure 4.) with a reduction in precession of the solstice driven summer insolation (6 W m−2 insolation at 65°N) for the last 2,000 years. See Figure 3F. The publication indicates a temperature decline of 0.22° ± 0.06°C per 1000 years, which tracks the slow decline in orbitally driven summer insolation at high northern latitudes.].

[vi] I. Borzenkova et al., 2015. Climate Change During the Holocene (Past 12,000 Years). In: The BACC II Author Team (eds) Second Assessment of Climate Change for the Baltic Sea Basin. Regional Climate Studies. Springer. https://link.springer.com/content/pdf/10.1007%2F978-3-319-16006-1.pdf

[vii]    US Environmental Protection Agency. Climate Change Indicators: Climate Forcing. https://www.epa.gov/climate-indicators/climate-change-indicators-climate-forcing#ref1.

[viii]   Data: (1) B.M. Vinther et al., 2009, “Holocene thinning of the Greenland ice sheet.” Nature, Vol. 461, pp. 385-388, 17 September 2009. National Centers for Environmental Information, NESDIS, NOAA, U.S. Department of Commerce. Greenland Ice Sheet Holocene d18O, Temperature, and Surface Elevation. doi:10.1038/nature08355. https://www.ncdc.noaa.gov/paleo-search/study/11148. Downloaded 05/05/2018. (2) HadCRUT4 near surface temperature data set for the Northern Hemisphere. http://www.metoffice.gov.uk/hadobs/hadcrut4/data/current/download.html. Downloaded 25 July 2018. Personal Research: All 39 climate trough-to-peak temperature rises exceeding +0.990C, between 5980 BCE and 1940 CE were extracted from the temperature data, derived from the Greenland ice core, for group analysis (range, +0.990C to +2.870C, average 77.4 years trough-to-peak, n=39).

[ix]     Global mean surface temperature data, commonly referred to as HadCRUT4. https://www.metoffice.gov.uk/hadobs/hadcrut4/data/current/download.html. [Exposé: Look at the bottom left hand or first column for the current year-to-date temperature. Subtract that from the 2016 total to see the magnitude of the fall. Global Data: https://bit.ly/2nCgctz. Northern Hemisphere Data: https://bit.ly/2MRt75G, Southern Hemisphere Data: https://bit.ly/2nBfYTA. Tropics Data: https://bit.ly/2nFXJMM. [last downloaded 25/07/2018].

[x]      Nicolaj K. Larsen et al., “The response of the southern Greenland ice sheet to the Holocene thermal maximum.” Geology ; 43 (4): 291–294. doi: https://doi.org/10.1130/G36476.1.

[xi]     D.S. Kaufman et al., “Holocene thermal maximum in the western Arctic (0–1800W).” Quaternary Science Reviews 23 (2004) 529–560.

[xii]    J.P. Briner et al., “Holocene climate change in Arctic Canada and Greenland.” Quaternary Science Reviews (2016), http://dx.doi.org/10.1016/j.quascirev.2016.02.010.

Glacier ice build up peaked during the Little Ice Age

Glacier ice build up peaked during the Little Ice Age

Arctic and Antarctic glacier ice build up began about 5,000 years ago after the Holocene Climate Optimum. Significant glacier advances occurred in many regions between the first and twelfth centuries CE, and more rapidly accumulated during the Little Ice Age (13th to 19th centuries). Much of this glacier ice melted after the mid-19th century as the sun entered its grand solar maximum phase.

Part A) of the image presents three smaller images (from 15) extracted from a time series of the Laurentide and Greenland ice sheets during the Holocene. The complete time series shows a stepwise reduction in ice extent from 11,500 years ago to its minimum extent 5,800 years ago.[1] B) A stacked time series of glacier advances and retractions during the last two millennia. A small number of glacier advances occurred in many regions between the first and twelfth centuries CE. There was a sharp increase in the number of glacier advances from the 13th century to the mid-19th century, after which glaciers started to recede.[2]


The Arctic has more ice today than at the Holocene Climate Optimum

More generally, the Arctic’s Holocene Climate Optimum occurred between 8,000 and 5,000 years ago, varying regionally in onset. Temperatures were in general two to four degrees Celsius higher than today.[3],[4],[5]

Greenland’s ice sheet margins retreated to less than their extent today between seven and four thousand years ago,[6] reaching their minimum extent between five and three thousand years ago.[7] The zone of coastal ice melt in the Arctic also retreated five hundred kilometers farther north, and there were summers free of sea ice.[8]

After the climate optimum, ice began to accumulate once again. This is evidenced by an abrupt ice accumulation along Greenland’s north coast starting 5,500 years ago; northeast Greenland was ice-locked by about 3,000 years ago.[9] In Greenland’s southeast, today’s Kulusuk glacier region had been ice-free during the climate optimum. Then, between 4,100 and 1,300 years ago, there were six major glacial advances, which coincided with major cooling episodes in the North Atlantic Ocean.[10]

The number of glacial advances in the second millennium CE was greater than in the first millennium, with most of the geographically widespread and extensive advances taking place during the Little Ice Age between the 13th and mid-19th centuries (see Figure 3.4B).[11] During this time winter sea ice closed off previously accessible sea routes between Scandinavia and Greenland.[12]

Beginning in the mid-19th century, as temperatures increased again, glacier ice began to melt, with this accelerating over the past five decades.[13],[14],[15]

Antarctica has more ice today than at the Holocene Climate Optimum

During the last glacial maximum, about 20,000 years ago, some parts of the Antarctic ice sheet reached the continental shelf edge.[16],[17] Initial ice retreat from the last glacial maximum was under way by between 17,000 and 14,000 years ago, and between 10,000 and 8,000 years ago melting extended into Antarctica’s interior, with deglaciation continuing until about 5,000 years ago.[18]

A widespread early Holocene Climate Optimum took place between 11,500 and 9,000 years ago, with a secondary optimum between 8,000 and 5,000 years ago. By 5,000 years ago most of the Antarctic glaciers had retreated to, or behind, their current positions.[19] During Antarctica’s climate optimum the central interior domes of the ice sheet were actually about one hundred meters lower than today, telling us there was less ice than exists today.[20]

During the last eight centuries Antarctica’s ice mass has waxed and waned. Periods of high ice accumulation occurred during the last millennia, most notably between the 14th and early 17th centuries, coinciding with the Little Ice Age. Since the 1960s ice accumulation has increased in the high coastal regions and over the highest part of east Antarctica.[21]

Click on this page and download a free copy of my book “Revolution: Ice Age Re-Entry,” and read more about this topic in Chapter 3.


[1]      Jason P. Briner et al., “Holocene climate change in Arctic Canada and Greenland.” Quaternary Science Reviews, Volume 147, 2016, 340-364, ISSN 0277-3791. https://doi.org/10.1016/j.quascirev.2016.02.010.

[2]      O.N. Solomina et al., 2016, “Glacier fluctuations during the past 2000 years.” Quaternary Science Reviews, 149, 61-90. DOI: 10.1016/j.quascirev.2016.04.008. [See Figure 5, page 276. This figure collates a stacked time series of the number of glacier advances and recessions in each region into a global total.].

[3]      Nicolaj K. Larsen et al., “The response of the southern Greenland ice sheet to the Holocene thermal maximum.” Geology ; 43 (4): 291–294. doi: https://doi.org/10.1130/G36476.1.

[4]      D.S. Kaufman et al., “Holocene thermal maximum in the western Arctic (0–1800W).” Quaternary Science Reviews 23 (2004) 529–560.

[5]      J.P. Briner et al., “Holocene climate change in Arctic Canada and Greenland.” Quaternary Science Reviews (2016), http://dx.doi.org/10.1016/j.quascirev.2016.02.010.

[6]      Nicolaj K. Larsen et al., “The response of the southern Greenland ice sheet to the Holocene thermal maximum.” Geology ; 43 (4): 291–294. doi: https://doi.org/10.1130/G36476.1.

[7]      J.P. Briner et al., “Holocene climate change in Arctic Canada and Greenland.” Quaternary Science Reviews (2016), http://dx.doi.org/10.1016/j.quascirev.2016.02.010.

[8]      Leonid Polyak et al., “History of sea ice in the Arctic.” Quaternary Science Reviews 29 (2010) 1757–1778, https://doi.org/10.1016/j.quascirev.2010.02.010.

[9]      Leonid Polyak et al., “History of sea ice in the Arctic.” Quaternary Science Reviews 29 (2010) 1757–1778, https://doi.org/10.1016/j.quascirev.2010.02.010.

[10]    N. L. Balascio et al., “Glacier response to North Atlantic climate variability during the Holocene.” Climate of the Past, 11, 1587-1598, https://doi.org/10.5194/cp-11-1587-2015, 2015.

[11]    O. N. Solomina et al., 2016, “Glacier fluctuations during the past 2000 years.” Quaternary Science Reviews, 149, 61-90. DOI: 10.1016/j.quascirev.2016.04.008. [See Figure 5, page 276. This figure collates a stacked time series of the number of glacier advances and recessions in each region into a global total.].

[12]    Michael E Mann, “Little Ice Age.” Volume 1, The Earth system: physical and chemical dimensions of global environmental change, 504–509. In Encyclopedia of Global Environmental Change (ISBN 0-471-97796-9).

[13]    Leonid Polyak et al., “History of sea ice in the Arctic.” Quaternary Science Reviews 29 (2010) 1757–1778, https://doi.org/10.1016/j.quascirev.2010.02.010

[14]    Christophe Kinnard et al., “A changing Arctic seasonal ice zone: Observations from 1870–2003 and possible oceanographic consequences.” Geophysical Research Letters, Volume 35, L02507, doi:10.1029/2007GL032507, 2008.

[15]    O.N. Solomina et al., 2016, “Glacier fluctuations during the past 2000 years.” Quaternary Science Reviews, 149, 61-90. DOI: 10.1016/j.quascirev.2016.04.008. [See Figure 5, page 276. This figure collates a stacked time series of the number of glacier advances and recessions in each region into a global total.].

[16]    A.N. Mackintosh et al., 2014, “Retreat history of the East Antarctic Ice Sheet since the Last Glacial Maximum.” Quaternary Science Reviews 100, 10e30. http://dx.doi.org/10.1016/j.quascirev.2013.07.024.

[17]    The RAISED Consortium1, Michael J. Bentley et al. “A community-based geological reconstruction of Antarctic Ice Sheet deglaciation since the Last Glacial Maximum.” Quaternary Science Reviews. Volume 100, 15 September 2014, 1-9.

[18]    Ó. Ingólfsson et al., 1998, “Antarctic glacial history since the Last Glacial Maximum: An overview of the record on land.” Antarctic Science, 10(3), 326-344. doi:10.1017/S095410209800039X.

[19]    Ó. Ingólfsson et al., 1998, “Antarctic glacial history since the Last Glacial Maximum: An overview of the record on land. “Antarctic Science, 10(3), 326-344. doi:10.1017/S095410209800039X.

[20]    The RAISED Consortium1, Michael J. Bentley et al. “A community-based geological reconstruction of Antarctic Ice Sheet deglaciation since the Last Glacial Maximum.” Quaternary Science Reviews. Volume 100, 15 September 2014, 1-9.

[21]    M. Frezzotti1 et al., “A synthesis of the Antarctic surface mass balance during the last 800 years.” The Cryosphere, 7, 303–319, 2013. www.the-cryosphere.net/7/303/2013/doi:10.5194/tc-7-303-2013. [See Figure 5.A, 312.].

Abrupt global cooling happens after extreme global warming phases

Abrupt global cooling happens after extreme global warming phases

Extreme Arctic warming phases switch abruptly to Arctic cooling phases. The 1700-2016 Arctic warming phase was the most extreme since the Holocene Climate Optimum. After the Arctic’s climate optimum the temperature declined 4.860C by 1700. This decline took place in a oscillatory manner over centennial timescales. These climate oscillations comprised 39 temperature increases exceeding 0.990C (trough-to-peak phases, range 1–15 decades, mean 88 years), which were followed by temperature declines exceeding 0.990C (peak-to-tough phases, range 1–10 decades, mean 76 years), among smaller temperature oscillations.

A) Thirty-nine trough-to-peak temperature rises exceeding 0.990C (red segments) between 7980 years ago and 1960 were extracted from the Greenland ice core for analysis. To help visualize statistical outliers, upper/lower Bollinger bands (pale grey) are used to highlight the peaks and troughs falling outside two standard deviations (95% confidence limits relative to a 60-period moving average, black line). The 39 trough-to-peak rises (warming phases) were not normally distributed and were therefore stratified into two groups (Group 2 ≤ 1.770C and Group 1 ≥ 1.770C) based on goodness-of-fit and outlier tests. The outlier test highlighted that those peaks rising more than 1.770C were significant outliers, and that the 2.870C rise from 1700-1940 was the biggest outlier or most extreme warming phase. This stratification yielded two normally distributed groups that were significantly different from one another. B) This figure graphically displays the 39 trough-to-peak warming phases (rebased) plus a grafted peak +2.810C (1840-2016 CE). Group 1 outliers are blue and red (extreme outliers), while Group 2 comprise all non-blue/red lines.[i]

Based on this above comparative analysis of extracted trough-to-peak temperature rises, or warming phases, I conclude that there is a greater probability the ice core temperature will decline than continue its rise through the rest of the 21st century.

Outlier Arctic warming phases fall abruptly after the climate switches to a cooling phase

A further statistical analysis of the above Groups 1 and 2 Arctic warming phases was conducted. This analysis shows that when the climate switches, the temperature decline is deeper and more abrupt with the Group 1 outliers than with Group 2.

Groups 1 and 2 were compared for their magnitude of temperature decline, and the time taken to reach the first post-peak and the final temperature troughs. Group 1 (the big outlier warming peaks) dropped rapidly to its maximum decline of 1.920C within 40 years, whereas Group 2 declined 1.030C in a similar timeframe. This difference in temperature decline was statistically significant (see the citation).[ii]

Some of the Arctic’s coldest periods, biggest glacier advances, and important rapid cooling events since the Holocene Climate Optimum are included in Group 1 (see previous citation’s table for the years involved).[iii],[iv],[v] Group 1 also includes the 4.2 kiloyear rapid climate change event associated with the extreme drought that precipitated the fall of Ancient Egypt’s Old Kingdom, the Akkadian Empire, and the Indus Valley Culture.

The conclusion I drew from this analysis is the bigger the trough-to-peak phase, the greater the magnitude of temperature drop and the more abruptly it falls from peak-to-trough after the peak (i.e., within 40 years). The implication for this current 1700-2016 warming phase is that the climate will switch back to a cooling phase, and the temperature will decline sharply.

Click on this page and download a free copy of my book “Revolution: Ice Age Re-Entry,” and read more about this topic in Chapter 4.


[i]       Data: (1) B.M. Vinther et al., 2009, “Holocene thinning of the Greenland ice sheet.” Nature, Vol. 461, pp. 385-388, 17 September 2009. National Centers for Environmental Information, NESDIS, NOAA, U.S. Department of Commerce. Greenland Ice Sheet Holocene d18O, Temperature, and Surface Elevation. doi:10.1038/nature08355. https://www.ncdc.noaa.gov/paleo-search/study/11148. Downloaded 05/05/2018. (2) HadCRUT4 near surface temperature data set for the Northern Hemisphere. http://www.metoffice.gov.uk/hadobs/hadcrut4/data/current/download.html. Downloaded 25 July 2018. Personal Research: All 39 climate trough-to-peak temperature rises exceeding +0.990C, between 5980 BCE and 1940 CE were extracted from the temperature data, derived from the Greenland ice core, for group analysis (range, +0.990C to +2.870C, average 77.4 years trough-to-peak, n=39). These trough-to-peak temperature increases selected trough-to-peaks to start from the deepest time point in the maximum trough preceding the tallest peak. A goodness-of-fit test of all 39 trough-to-peak temperature rises showed that the data did not follow a normal distribution. This indicates the possibility that more than one global warming process may be involved with the bigger climate oscillation outliers (i.e., an extreme grand solar maxima). Results: Prior to stratifying the data an Iglewicz and Hoaglin’s robust test (two-sided test) for multiple outliers was performed using a modified Z score of ≥1.5 and ≥5 as the outlier criteria. The modified Z score of ≥1.5 highlighted significant outliers above +1.770C. A higher modified Z score of ≥5 yielded the most extreme outlier the +2.870C trough-to-peak between 1700 and 1940. Given the outliers that were revealed, the data was stratified into two groups (0.990C – 1.770C or ≥ 1.770C). This stratification yielded 2 normally distributed groups (Group-1, N=5, Group-2 N=34), that were, statistically, significantly different from one another (unpaired Welch T-Test, 2-tailed P-value = 0.007). Group 1’s smallest temperature rise was 0.210C greater than Group 2’s largest temperature rise, highlighting the gap between the two groups. On the basis of the above, the peak-to-trough temperature rise from 1700 to 1940 (+2.870C) was confirmed as the most significant outlier. This process was repeated for the grafted peak from 1840-2016 (+2.810C) as detailed in Figure 4.1. Group-1 swapped the +2.870C with the +2.810C, which was also statistically, significantly different from Group-2 (unpaired Welch T-Test, two-sided P-value = 0.0061). Conclusion: Group-1 (N=5) composed of trough-to-peak outliers ≥ 1.770C were significantly larger global warmings than Group-2 (N=34), and the +2.870C or +2.810C were the largest outliers.

[ii]       Data: (1) B.M. Vinther et al., 2009, “Holocene thinning of the Greenland ice sheet.” Nature, Vol. 461, pp. 385-388, 17 September 2009. National Centers for Environmental Information, NESDIS, NOAA, U.S. Department of Commerce. Greenland Ice Sheet Holocene d18O, Temperature, and Surface Elevation. doi:10.1038/nature08355. https://www.ncdc.noaa.gov/paleo-search/study/11148. Downloaded 05/05/2018. Personal Research: Groups 1 and 2 (previous citation) were compared by their magnitudes of decline from the temperature peak to see if there was a difference between them once the climate switched to a cooling phase. The time to reach the first post-peak trough, and to their maximum troughs was calculated. Each group had a normal distribution (d’Agostino-Pearson test and Shapiro-Wilks test: P>0.05) but a different variance. As such a Welch T-test (unpaired) was used to assess group differences. Results: Group 1 (≥1.770C trough-to-peak) showed a mean temperature decline at the 1st trough after the peak of 1.920C versus Group 2’s (≤1.770C trough-to-peak) mean temperature decline of 1.030C, which represented a statistically significant difference in temperature decline over Group 1 (2-tailed P-value = 0.0433). Group 1 showed a mean temperature decline at the maximum trough after the peak of 1.920C versus Group 2’s mean temperature decline of 1.230C, but this difference was not significantly different (-0.690C, P-value 0.0784). Moreover, Group 1 rapidly declined such that its first post-peak trough was the same as its maximum trough i.e., Group 1 temperature fell abruptly. Group 2 showed a difference between its first and maximum trough of -0.200C, which was significantly different (P-value = 0.001928). Group 1 took two intervals (i.e., 45 years) to drop -1.920C with its first and maximum trough being the same (-1.920C). By contrast, Group 2 took on mean 1.82 intervals (i.e., 36 years) to reach its first trough and 3.15 intervals (i.e., 63 years) to reach its deepest trough. Conclusion: The higher the preceding trough-to-peak temperature rise (statistical outlier, or tall temperature peaks) the greater and more abrupt the temperature falls to near its maximum trough when the climate switches.

[iii]      Olga N. Solomina et al., “Holocene glacier fluctuations.” Quaternary Science Reviews. Volume 111, 2015, 9-34. https://doi.org/10.1016/j.quascirev.2014.11.018.

[iv]      C. Andersen et al., “A highly unstable Holocene climate in the subpolar North Atlantic: evidence from diatoms.” Quaternary Science Reviews, Volume 23, Issues 20–22, 2004, 2155-2166. https://doi.org/10.1016/j.quascirev.2004.08.004.

[v]       H. Wanner et al., “Structure and origin of Holocene cold events.” Quaternary Science Reviews (2011), doi:10.1016/j.quascirev.2011.07.010.

Slowest ice age entry temperature decline in two million years

Slowest ice age entry temperature decline in two million years

This ice age entry after the Holocene Climate Optimum is the slowest of to decline in temperature compared with all 33 previous glacial cycles in the last 2 million years (global data). If the climate system has a tendency to revert to the mean, then a significant global cooling will occur during the 21st century.

The first 2,100 years of temperature data after a climate optimum was extracted for the last 34 glacial cycles, and was rebased to zero degrees and zero time. The temperature declined by 0.610C after the Holocene Climate Optimum, which was 1.260C above the average of all other glacial cycles in 2,026,800 years (global data).[i]

The temperature decline 2,100 years after the Holocene Climate Optimum (global data) is the smallest decline compared with all 33 previous glacial cycles 2,100 years after their respective climate optima, in the past 2,026,800 years. While this current global ice age inception temperature decline is the biggest outlier (i.e., slowest to cool), it is not a statistically significant outlier (i.e., P-value >0.05).

The above-cited data suggests that if the climate system has a tendency to revert to the mean, then a significant global cooling will occur during the 21st century.

Click on this page and download a free copy of my book “Revolution: Ice Age Re-Entry,” and read more about this topic in Chapter 3.


[i]       Data: R. Bintanja and R.S.W. van de Wal, “North American ice-sheet dynamics and the onset of 100,000-year glacial cycles.” Nature, Volume 454, 869-872, 14 August 2008. doi:10.1038/nature07158. National Centers for Environmental Information, NESDIS, NOAA, U.S. Department of Commerce. Global 3Ma Temperature, Sea Level, and Ice Volume Reconstructions. https://www.ncdc.noaa.gov/paleo-search/study/11933. Downloaded 10/27/2015. Personal Research: The temperature data for the first 2,100 years from the climate optimum was extracted for the last 34 glacial cycles. This temperature time-series was rebased to zero degrees and zero time so all glacial cycles could be compared on the same basis, i.e., from their peaks. The temperature declined by 0.610C after the Holocene Climate Optimum, which was 1.260C above the average of all other glacial cycles in 2,026,800 years. The current glacial cycle’s slow decline was not a significant outlier in the group.

Pin It on Pinterest