Solar activity also may also control our ice age entry via large magnitude volcanic eruptions

Solar activity also may also control our ice age entry via large magnitude volcanic eruptions

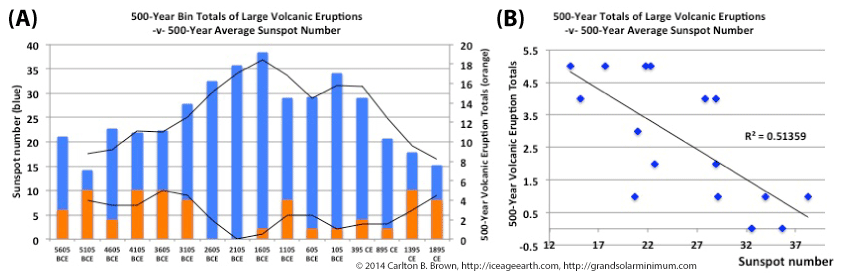
The above figure highlights a statistically inverse relationship between the 500 year average sun spot numbers and the 500 year total of large magnitude volcanic eruptions. This indicates that as the long term solar activity declines, the number of large magnitude volcanic eruptions per 500 years increases. Therefore if low long-term sunspot numbers are involved in triggering climate-forcing volcanism, then a long-term process involving magnetized solar wind is implicated (because these sun spot numbers were derived from tree-ring carbon-14 cosmogenic isotope data).

The Figure A. above highlights the five hundred-year totals of large volcanic eruptions plotted against 500-year average sunspot numbers since the Holocene Climate Optimum 8,000 years ago. A significant inverse correlation is demonstrated between these two parameters (R= -0,72, P-value 0.002). The last 2,500 years have seen a declining trend in 500-year sunspot numbers, with the 500-year period ending in 1895 having the lowest 500-year sunspot number average in 7,500 years. Figure B) above shows a scatter plot of Figure A’s data to highlight a linear relationship between these variables.[1]

The above-described relationship markedly diminished when the period of correlation calculation was extended from the last 8,000 years out to the last 11,000 years. The correlation also diminished when the duration of the 500-year average sunspot numbers and the 500-year bin totals of climate-forcing volcanic eruptions were each reduced to 400 and 300 years. If the solar activity-volcanism relationship is real, then a long-term process involving magnetized solar wind is implicated in causing climate-forcing volcanic eruptions, because these sunspot numbers were derived from carbon-14 isotopes found in tree rings (see citation note).[2]

A stronger non-linear relationship than described above was demonstrated using the VOGRIPA Large Magnitude Explosive Volcanic Eruption database data, while utilizing the same methodology detailed for the cited figures above. This non-linear relationship, if real, would seem to indicate that as the 500-year average sunspot number declines below 17 there is an accelerative increase in climate-forcing large magnitude volcanic eruptions (VEI 4–7), i.e., more bang for your low sunspot number buck. However, caution is merited in interpreting this potential non-linear relationship, given that many volcanic eruptions in the more distant past (i.e., before the last millennium) are not part of the scientific record. This can give the impression of an accelerative increase in volcanism during the Little Ice Age.[3],[4]

Click on this page and download a free copy of my book “Revolution: Ice Age Re-Entry,” and read more about this topic in Chapter 5 and answers to the above question.


[1]      Data: (1) Takuro Kobashi et al., 2017, “Volcanic influence on centennial to millennial Holocene Greenland temperature change.” Scientific Reports, 7, 1441. doi: 10.1038/s41598-017-01451-7. Data provided by the National Centers for Environmental Information, NESDIS, NOAA, U.S. Department of Commerce. https://www.ncdc.noaa.gov/paleo-search/study/22057. Data accessed 21/08/2018. (2) S.K. Solanki et al., 2004, “An unusually active Sun during recent decades compared to the previous 11,000 years.” Nature, Volume 431, No. 7012, 1084-1087, 28 October 2004. Data: S.K. Solanki et al., 2005, “11,000 Year Sunspot Number Reconstruction.” IGBP PAGES/World Data Center for Paleoclimatology. Data Contribution Series #2005-015. NOAA/NGDC Paleoclimatology Program, Boulder CO, USA. https://www.ncdc.noaa.gov/paleo-search/study/5780. Downloaded 05/06/2018. Personal Research: Figure A). Using the above-cited data and the methodology cited in Figure 5.1.A of my book (Revolution: Ice Age Re-Entry, https://amzn.to/2PyQsxV), the largest climate-forcing volcanic eruptions (≤5 Watts/meter-squared) were grouped into 500-year bin totals starting in 1895 and extending back 8,000 years. Five hundred-year average sunspot numbers were generated for the corresponding periods. Figure 5.3.A: Both previously derived parameters were plotted against one another and a two-period moving average created to highlight the inverse relationship. Figure B). Both previously derived parameters were plotted using a scatter plot (Microsoft Excel) and a linear trend line fitted. Pearson and Spearman rank correlations were calculated, with both yielding a correlation coefficient r = -0.72, two-tailed P-value 0.002 (N=43 eruptions organized into 16 groups). There were no outliers for either parameter. A goodness of fit using the Shapiro-Wilks test indicated the 500-year sunspot number averages were normally distributed. The 500-year bin totals of volcanic eruptions yielded a P = 0.031 indicating a non-normal distribution, hence the Spearman rank correlation inclusion.

[2]      I.G.M. Usoskin et al., “Solar activity, cosmic rays, and Earth’s temperature: A millennium-scale comparison.” Journal of Geophysical Research, 110, A10102, doi:10.1029/2004JA010946. [Exposé: See page 1. This tells us cosmogenic isotopes (Beryllium-10, Carbon-14) are used as proxies for solar activity, and that their production is caused by galactic cosmic ray flux, which is influenced by the solar system’s (heliospheric) magnetic field and is modulated by solar activity. Comment: Magnetized solar wind modulates the solar system’s magnetic shield (i.e., the heliosphere) and the earth’s magnetic shield (i.e. the magnetosphere), thereby regulating cosmic ray entry into the solar system and the earth system respectively. Cosmic ray entry into the upper atmosphere from space is modulated by solar activity and geomagnetism. Lower solar activity and lower geomagnetism permit more cosmic ray entry into the atmosphere, and conversely. Increased cosmic ray levels are associated with increased low-cloud formation, which is associated with planetary cooling, and conversely. The cosmic ray and low-cloud cooling effect are concentrated into the polar regions. Cosmogenic isotopes (Carbon-14, Beryllium-10) are generated by cosmic rays in the atmosphere, with more cosmic rays generating more cosmogenic isotopes, and conversely. Cosmogenic isotopes are then embedded in earth repositories (i.e., tree rings, ice cores) and therefore indirectly tell us about solar activity and the resulting magnetized solar wind that contacts the earth’s magnetosphere. By utilizing cosmogenic isotopes to assess relationships between the sun and earth systems (i.e., climate, volcanism) we know that the solar activity that is being assessed is magnetism based, and not electromagnetism (i.e. not solar irradiance).].

[3]      Data: (1) Helen Sian Crosweller et al., “Global database on large magnitude explosive volcanic eruptions (LaMEVE).” Journal of Applied Volcanology Society and Volcanoes 20121:4. https://doi.org/10.1186/2191-5040-1-4. Volcano Global Risk Identification and Analysis Project database (VOGRIPA), British Geological Survey. Data Access: http://www.bgs.ac.uk/vogripa/. Data downloaded 07/05/2018. (2) S.K. Solanki et al., 2004, “An unusually active Sun during recent decades compared to the previous 11,000 years.” Nature, Volume 431, No. 7012, 1084-1087, 28 October 2004. Data: S.K. Solanki et al., 2005, “11,000 Year Sunspot Number Reconstruction.” IGBP PAGES/World Data Center for Paleoclimatology. Data Contribution Series #2005-015. NOAA/NGDC Paleoclimatology Program, Boulder CO, USA. https://www.ncdc.noaa.gov/paleo-search/study/5780. Downloaded 05/06/2018. Personal Research: Utilizing VOGRIPA’s LaMEVE VEI 4-7 eruption events, these were grouped into 500-year bins from 1899 and back over the prior 5,000 years. The above cited Solanki, S.K., et al. was used to calculate 500-year average sunspot numbers. Using Microsoft Excel scatter plots were created, and various trend lines were fitted to the data. The power trend best optimized the R-squared value; (1) Power 0.803 versus (2) Exponential 0.748, (3) Logarithmic 0.713, and (4) Linear 0.639. The significant non-linear expansion in the number of large magnitude volcanic eruptions observed during the period 1400 to 1899 CE (i.e., the Little Ice Age) corresponded with the lowest 500-year average sunspot number in 7,000 years (mean of 15 sunspots). Cautionary Note: See the following citation (S.K. Brown et al., 2014) for an analysis-critique of the VOGRIPA database’s recognized underreporting bias. This inadvertent underreporting of eruptions theoretically skews the data, so a higher incidence of volcanic eruptions or a growing frequency is more “apparent” over the last millennium. The VOGRIPA database represents the best of its kind and compiles numerous other databases. This LaMEVE database skewing gives the impression of an acceleration effect in the frequency of VEI 4-7 eruptions over the last 1,000 years compared with the prior 10,000 years and 2.6 million year period. This theoretically confounds the interpretation of the result, meriting caution with its interpretation. However, the VOGRIPA data derived result should not be fully dismissed because it highlights a similar trend to the Kobashi et al data (previously cited).].

[4]      S.K. Brown et al., “Characterization of the Quaternary eruption record: analysis of the Large Magnitude Explosive Volcanic Eruptions (LaMEVE) database.” J Appl. Volcanology. (2014) 3: 5. https://doi.org/10.1186/2191-5040-3-5.
Pandemic influenza outbreaks are linked to solar activity

Pandemic influenza outbreaks are linked to solar activity

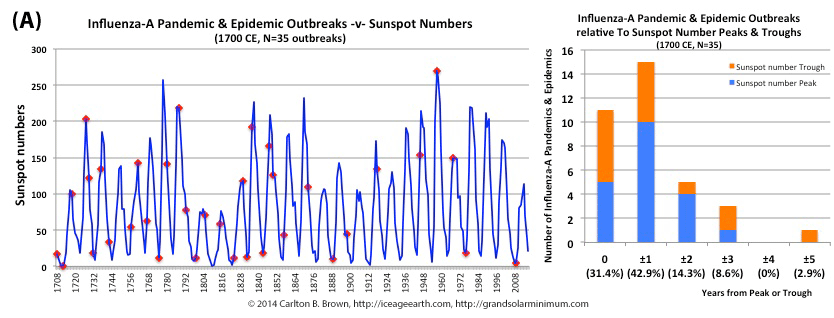
The majority of pandemic influenza outbreaks since 1700 CE were associated with minima and maxima of sun spot numbers linked to the 11 year solar cycle. In fact, seventy-four percent of influenza pandemics and epidemics (26/35 events) since 1700 occurred at or within one year of the peak or trough in sunspot numbers, increasing to 89 percent (31/35) within two years. 


Figure A above. Historical pandemic and epidemic influenza-A outbreak data was extracted from six scientific publications reviewing the history of influenza, providing a general consensus on pandemic flu outbreaks (and major regional epidemics) back to 1500. These were plotted against observed sunspot numbers. See the citation for all data.[i] Seventy-four percent of influenza pandemics and epidemics (26/35 events) since 1700 CE occurred at or within one year of the peak or trough in sunspot numbers, increasing to 89 percent (31/35) within two years. The average sunspot number for pandemics occurring at sunspot number troughs was 12 (18 for pandemics occurring within one year of a sunspot number trough). The 2018 sunspot number was 22.

Based on sunspot numbers, we are approaching a high-risk period for pandemic flu. This increased risk is given more gravity, considering half of all pandemics since 1600 CE occurred in the trough of grand solar minima. The sun has already entered a grand solar minimum.

The influenza-A viruses we really have to worry about are highly pathogenic avian influenza-A H7N9 and H5N1. Since 1997 other animal influenza-A viruses have also killed humans, and these continue to pose risks.[ii],[iii],[iv],[v]

H7N9 is killing between 25 and 40 percent of humans infected.[vi],[vii] Animal-to-human infections emerged in China in 2013, and grew year by year to a total of 1,600 animal-to-human infections reported by 2017.[viii],[ix],[x] Specific viral mutations that facilitate human infection have since emerged,[xi] meaning human-to-human transmission is next. The situation is similar with the H5N1 virus, which has killed more than 50 percent of humans infected.[xii],[xiii],[xiv],[xv]

Pandemics have historically spread rapidly throughout the world, and up to half the human population is typically infected.[xvi],[xvii],[xviii],[xix] Pandemic flu viruses that kill a high percentage of their victims do so because they cause a high incidence of severe pneumonia and multi-organ failure. This requires intensive hospital care, with the availability of hospital intensive care a potential bottleneck.

The 1918–1919 pandemic flu virus caused acute swelling of and bleeding from the lungs, and people who were infected typically suffocated within one to two days. The second wave of the pandemic was responsible for the most deaths, due to an unusually severe hemorrhagic pneumonia. H5N1 victims today experience similar pathologies to those of the 1918–1919 pandemic, with acute respiratory distress syndrome occurring in 50 to 75 percent of infections.[xx],[xxi]

Likewise, since 2013 more than 90 percent of humans dying from H7N9 infection suffered from pneumonia, respiratory failure, or acute respiratory distress syndrome. Most of the infected people who were hospitalized were admitted to an intensive care unit. With ongoing viral mutations of H7N9 known to improve human viral transmission,[xxii] this is a very worrying virus indeed.

Click on this page and download a free copy of my book “Revolution: Ice Age Re-Entry,” and read more about this topic in Chapter 14.


[i]   Data: (1) Yearly mean total sunspot number (1700 – 2017). Sunspot data from the World Data Center SILSO, Royal Observatory of Belgium, Brussels. http://sidc.be/silso/datafiles#total. Downloaded 05/05/2018. (2) Influenza pandemic and epidemic publications: (a) B. Lina, 2008, History of Influenza Pandemics. In: Raoult D., Drancourt M. (eds) Paleomicrobiology. Springer, Berlin, Heidelberg. https://doi.org/10.1007/978-3-540-75855-6_12. (b) E. Tognotti, 2009, Influenza pandemics: a historical retrospect. Journal of Infection in Developing Countries, 3:331-334. doi: https://doi.org/10.3855/jidc.239. (c) C. Potter, 2001, A history of influenza. Journal of Applied Microbiology, 91: 572-579. doi:10.1046/j.1365-2672.2001.01492.x. (d) J.K. Taubenberger and D.M. Morens, 1918 Influenza: the Mother of All Pandemics. Emerging Infectious Diseases. 2006;12(1):15-22. doi:10.3201/eid1201.050979. (e) Edwin D. Kilbourne, Influenza. Chapter 1; History of Influenza. Springer Science & Business Media, 6/12/2012 – Medical. ISBN 978-1-4684-5239-6. (f) Svenn-Erik Mamelund, Influenza, Historical. December 2008. International Encyclopedia of Public Health, First Edition (2008), vol. 3, pp. 597-609. DOI: 10.1016/B978-012373960-5.00372-5..

[ii] J.K. Taubenberger and D.M. Morens, “Pandemic influenza – including a risk assessment of H5N1.” Revue scientifique et technique (International Office of Epizootics). 2009;28(1):187-202.

[iii] M. Gilbert et al., “Climate change and avian influenza.” Revue scientifique et technique (International Office of Epizootics). 2008;27(2):459-466.

[iv] Mark A. Miller et al., “The Signature Features of Influenza Pandemics —Implications for Policy.” New England Journal of Medicine2009; 360:2595-2598. DOI: 10.1056/NEJMp0903906.

[v] Paul Gillard et al., “Long-term booster schedules with AS03Aadjuvanted heterologous H5N1 vaccines induces rapid and broad immune responses in Asian adults.” BMC Infectious Diseases201414:142. https://doi.org/10.1186/1471-2334-14-142.

[vi] Hai-Nv Gao et al., “Clinical Findings in 111 Cases of Influenza A (H7N9) Virus Infection.” New England Journal of Medicine2013; 368:2277-2285. DOI: 10.1056/NEJMoa1305584.

[vii] Qi Tang et al., “China is closely monitoring an increase in infection with avian influenza A (H7N9) virus.” BioScience Trends. 2017; 11(1):122-124. DOI: 10.5582/bst.2017.01041.

[viii] Yamayoshi S et al., “Enhanced Replication of Highly Pathogenic Influenza A(H7N9) Virus in Humans.” Emerging Infectious Diseases Journal 2018;24(4):746-750. https://dx.doi.org/10.3201/eid2404.171509.

[ix] European Centre for Disease Prevention and Control. “Human infection with avian influenza A(H7N9) virus–fifth update.” 27 February 2017. Stockholm: ECDC; 2017.

[x] Artois J et al., “Changing Geographic Patterns and Risk Factors for Avian Influenza A(H7N9) Infections in Humans, China.” Emerging Infectious Diseases Journal 2018;24(1):87-94. https://dx.doi.org/10.3201/eid2401.171393.

[xi] N. Xiang et al., “Assessing Change in Avian Influenza A(H7N9) Virus Infections During the Fourth Epidemic — China.” September 2015–August 2016. MMWR Morb Mortal Wkly Rep 2016;65:1390–1394. DOI: http://dx.doi.org/10.15585/mmwr.mm6549a2.

[xii] U.S. Department of Health and Human Services. Pandemic Influenza Plan 2017 Update. https://www.cdc.gov/flu/pandemic-resources/pdf/pan-flu-report-2017v2.pdf.

[xiii] Centers for Disease Control and Prevention. “Highly Pathogenic Asian Avian Influenza A (H5N1) in People.” https://www.cdc.gov/flu/avianflu/h5n1-people.htm.

[xiv] Kumnuan Ungchusak et al., “Probable Person-to-Person Transmission of Avian Influenza A (H5N1). 2005.” New England Journal of Medicine2005; 352:333-340. DOI: 10.1056/NEJMoa044021.

[xv] L.O. Durand et al., “Timing of Influenza A(H5N1) in Poultry and Humans and Seasonal Influenza Activity Worldwide, 2004–2013.” Emerging Infectious Diseases Journal 2015;21(2):202-208. https://dx.doi.org/10.3201/eid2102.140877.

[xvi] B. Lina, 2008, “History of Influenza Pandemics.” In: Raoult D., Drancourt M. (eds) Paleomicrobiology. Springer, Berlin, Heidelberg. https://doi.org/10.1007/978-3-540-75855-6_12.

[xvii] E. Tognotti, “Influenza pandemics: a historical retrospect.” The Journal of Infection in Developing Countries 2009, 3: 331-334. DOI: https://doi.org/10.3855/jidc.239.

[xviii] C. Potter, 2001, “A history of influenza.” Journal of Applied Microbiology, 91: 572-579. doi:10.1046/j.1365-2672.2001.01492.x.

[xix] J.K. Taubenberger and D.M. Morens, “1918 Influenza: the Mother of All Pandemics.” Emerging Infectious Diseases. 2006;12(1):15-22. doi:10.3201/eid1201.050979.

[xx] Eugenia Tognotti, “Emerging Problems in Infectious Diseases Influenza pandemics: a historical retrospect.” The Journal of Infection in Developing Countries2009; 3(5):331-334.

[xxi] Yu-Chia Hsieh et al., “Influenza Pandemics: Past, Present and Future.” J. Formos Med Assoc. 2006 Jan;105(1):1-6. DOI:10.1016/S0929-6646(09)60102-9.

[xxii] Xiang N et al., “Assessing Change in Avian Influenza A(H7N9) Virus Infections During the Fourth Epidemic — China.” September 2015–August 2016. MMWR Morb Mortal Wkly Rep 2016;65:1390–1394. DOI: http://dx.doi.org/10.15585/mmwr.mm6549a2.

This grand solar minimum increases the risk of a pandemic influenza outbreak

This grand solar minimum increases the risk of a pandemic influenza outbreak

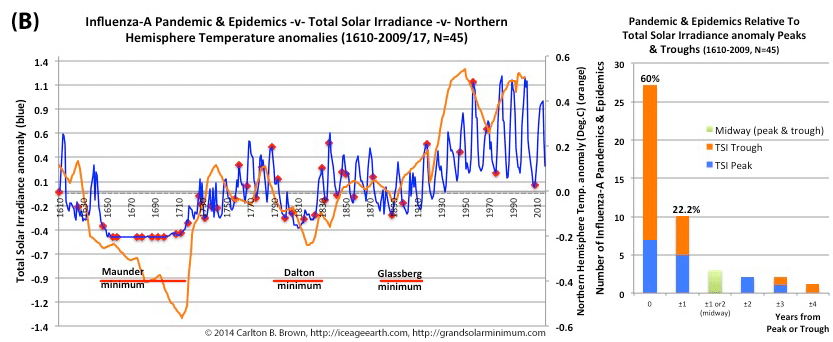
Grand solar minimum periods associated with a colder climate pose increased risks for pandemic infuenza outbreaks. In fact, half of all pandemic influenza outbreaks between 1600 and 2000 CE occurred when both the Northern Hemisphere temperature and total solar irradiance levels were below the 1600-2000 CE average, which corresponded with the grand solar minimum periods of the Little Ice Age.

Figure B) above. Historical pandemic influenza outbreak data was extracted from six scientific publications reviewing the history of influenza, providing a general consensus on pandemic flu outbreaks (and major regional epidemics) back to 1500. These were plotted against the total solar irradiance and Northern Hemisphere temperature data reconstructions. See the citation for all the data.[i] Between 1610 and 2000, eighty-two percent of influenza pandemics and epidemics (37/45) occurred at or within one year of a peak or trough in the total solar irradiance anomaly. At the same time, sixty-four percent (29/45) of influenza pandemics and epidemics occurred during a negative Northern Hemisphere temperature anomaly.

Half of outbreaks (22/45) between 1600 and 2000 CE occurred when both the Northern Hemisphere temperature and total solar irradiance anomaly were negative, which corresponded with the trough of grand solar minimum periods (during the Little Ice Age). Negative anomalies resulted when the temperature or irradiance value was less than the 1610-2000 average for that parameter.

The obvious conclusion is that grand solar minimum periods associated with a colder climate pose increased risks for pandemic flu outbreaks. The sun is plummeting into the depths of this grand solar minimum and in 2016 the Northern Hemisphere temperatures started to decline.[ii]

We should be VERY WORRIED that governments, the vaccine industry, and WHO will not be able to immunize the world before the peak of a pandemic, or supply sufficient vaccine in an equitable manner. We have the vaccine technology to solve this problem but this has not been implemented since 2009’s swine flu pandemic. Read Chapter 14 to find out why we are left fully vulnerable to a bad pandemic outbreak.

Click on this page and download a free copy of my book “Revolution: Ice Age Re-Entry,” and read more about this topic in Chapter 14.


[i] Data: (1) Figure 14.1.B: T. Kobashi et al., 2013. Causes of Greenland temperature variability over the past 4000 year: implications for northern hemispheric temperature changes. Climate of the Past, 9(5), 2299-2317. doi: 10.5194/cp-9-2299-2013. National Centers for Environmental Information, NESDIS, NOAA, U.S. Department of Commerce. Northern Hemisphere 4000 Year Temperature Reconstructions. https://www.ncdc.noaa.gov/paleo/study/15535. Downloaded 05/05/2018. (2) The total solar irradiance (TSI) reconstruction was based on NRLTSI2 (Coddington et al., BAMS, 2015 doi: 10.1175/BAMS-D-14-00265.1). http://spot.colorado.edu/~koppg/TSI/TIM_TSI_Reconstruction.txt. (3) Influenza pandemic and epidemic publications: (a) B. Lina, 2008, History of Influenza Pandemics. In: Raoult D., Drancourt M. (eds) Paleomicrobiology. Springer, Berlin, Heidelberg. https://doi.org/10.1007/978-3-540-75855-6_12. (b) E. Tognotti, 2009, Influenza pandemics: a historical retrospect. Journal of Infection in Developing Countries, 3:331-334. doi: https://doi.org/10.3855/jidc.239. (c) C. Potter, 2001, A history of influenza. Journal of Applied Microbiology, 91: 572-579. doi:10.1046/j.1365-2672.2001.01492.x. (d) J.K. Taubenberger and D.M. Morens, 1918 Influenza: the Mother of All Pandemics. Emerging Infectious Diseases. 2006;12(1):15-22. doi:10.3201/eid1201.050979. (e) Edwin D. Kilbourne, Influenza. Chapter 1; History of Influenza. Springer Science & Business Media, 6/12/2012 – Medical. ISBN 978-1-4684-5239-6. (f) Svenn-Erik Mamelund, Influenza, Historical. December 2008. International Encyclopedia of Public Health, First Edition (2008), vol. 3, pp. 597-609. DOI: 10.1016/B978-012373960-5.00372-5.

[ii]       Global mean surface temperature data, commonly referred to as HadCRUT4. https://www.metoffice.gov.uk/hadobs/hadcrut4/data/current/download.html. [Exposé: Look at the bottom left hand or first column for the current year-to-date temperature. Subtract that from the 2016 total to see the magnitude of the fall. Global Data: https://bit.ly/2nCgctz. Northern Hemisphere Data: https://bit.ly/2MRt75G, Southern Hemisphere Data: https://bit.ly/2nBfYTA. Tropics Data: https://bit.ly/2nFXJMM. [last downloaded 25/07/2018].

This grand solar minimum increases the risk of a pandemic influenza outbreak (increased cosmic rays)

This grand solar minimum increases the risk of a pandemic influenza outbreak (increased cosmic rays)

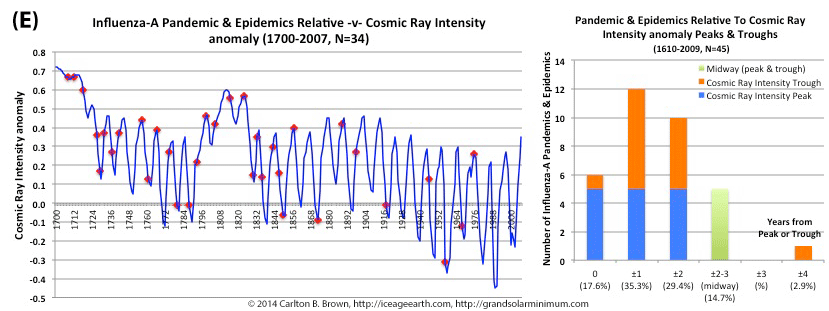
Low solar activity, typical of grand solar minimum periods, is associated with increased cosmic ray intensity levels and more pandemic influenza outbreaks. The majority (80%) of pandemics since 1700 took place when the cosmic ray intensity (CRI) level was above the average for the 1961-1990 period. This corresponded with a phase of relatively low solar activity and numerous grand solar minimum periods. Additonally, during this three century period more than half of pandemics occurred at or within one year of a peak or trough in cosmic ray intensity levels. Cosmic ray intensity anomaly and pandemic flu outbreaks are highlighted in the figure above (Figure C).[i]

Cosmic rays that enter earth’s atmosphere from space represent a well-established proxy for determining solar activity (see the citation for details).[ii] In addition to sunspot numbers, total solar irradiance, and Beryllium-10, the cosmic ray intensity offers a fourth solar activity parameter associated with pandemic influenza outbreaks. Four different solar activity parameters all showing peak and trough associations with pandemic outbreaks add strong support to the hypothesis that solar activity extremes portend increased risk for pandemic influenza outbreaks.

Click on this page and download a free copy of my book “Revolution: Ice Age Re-Entry,” and read more about this topic in Chapter 14—and why we should be very worried about a pandemic influenza outbreak this grand solar minimum.

[i] Data: (1) Usoskin, I.G., et al. 2008. Cosmic Ray Intensity Reconstruction. IGBP PAGES/World Data Center for Paleoclimatology. Data Contribution Series # 2008-013. NOAA/NCDC Paleoclimatology Program, Boulder CO, USA. Original References: 1) I.G. Usoskin et al., 2002, A physical reconstruction of cosmic ray intensity since 1610. Journal of Geophysical Research, 107(A11), 1374. Downloaded May 2018. ftp://ftp.ncdc.noaa.gov/pub/data/paleo/climate_forcing/solar_variability/usoskin-cosmic-ray.txt. (2) Influenza pandemic and epidemic publications: (a) B. Lina, 2008, History of Influenza Pandemics. In: Raoult D., Drancourt M. (eds) Paleomicrobiology. Springer, Berlin, Heidelberg. https://doi.org/10.1007/978-3-540-75855-6_12. (b) E. Tognotti, 2009, Influenza pandemics: a historical retrospect. Journal of Infection in Developing Countries, 3:331-334. doi: https://doi.org/10.3855/jidc.239. (c) C. Potter, 2001, A history of influenza. Journal of Applied Microbiology, 91: 572-579. doi:10.1046/j.1365-2672.2001.01492.x. (d) J.K. Taubenberger and D.M. Morens, 1918 Influenza: the Mother of All Pandemics. Emerging Infectious Diseases. 2006;12(1):15-22. doi:10.3201/eid1201.050979. (e) Edwin D. Kilbourne, Influenza. Chapter 1; History of Influenza. Springer Science & Business Media, 6/12/2012 – Medical. ISBN 978-1-4684-5239-6. (f) Svenn-Erik Mamelund, Influenza, Historical. December 2008. International Encyclopedia of Public Health, First Edition (2008), vol. 3, pp. 597-609. DOI: 10.1016/B978-012373960-5.00372-5.

[ii] I.G.M. Usoskin et al., “Solar activity, cosmic rays, and Earth’s temperature: A millennium-scale comparison.” Journal of Geophysical Research, 110, A10102, doi:10.1029/2004JA010946. [Exposé: See page 1. This tells us cosmogenic isotopes (Beryllium-10, Carbon-14) are used as proxies for solar activity, and that their production is caused by galactic cosmic ray flux, which is influenced by the solar system’s (heliospheric) magnetic field and is modulated by solar activity. Comment: Magnetized solar wind modulates the solar system’s magnetic shield (i.e., the heliosphere) and the earth’s magnetic shield (i.e. the magnetosphere), thereby regulating cosmic ray entry into the solar system and the earth system respectively. Cosmic ray entry into the upper atmosphere from space is modulated by solar activity and geomagnetism. Lower solar activity and lower geomagnetism permit more cosmic ray entry into the atmosphere, and conversely. Increased cosmic ray levels are associated with increased low-cloud formation, which is associated with planetary cooling, and conversely. The cosmic ray and low-cloud cooling effect are concentrated into the polar regions. Cosmogenic isotopes (Carbon-14, Beryllium-10) are generated by cosmic rays in the atmosphere, with more cosmic rays generating more cosmogenic isotopes, and conversely. Cosmogenic isotopes are then embedded in earth repositories (i.e., tree rings, ice cores) and therefore indirectly tell us about solar activity and the resulting magnetized solar wind that contacts the earth’s magnetosphere. By utilizing cosmogenic isotopes to assess relationships between the sun and earth systems (i.e., climate, volcanism) we know that the solar activity that is being assessed is magnetism based, and not electromagnetism (i.e. not solar irradiance).].

Extremes of Arctic sea ice are associated with pandemic influenza outbreaks

Extremes of Arctic sea ice are associated with pandemic influenza outbreaks

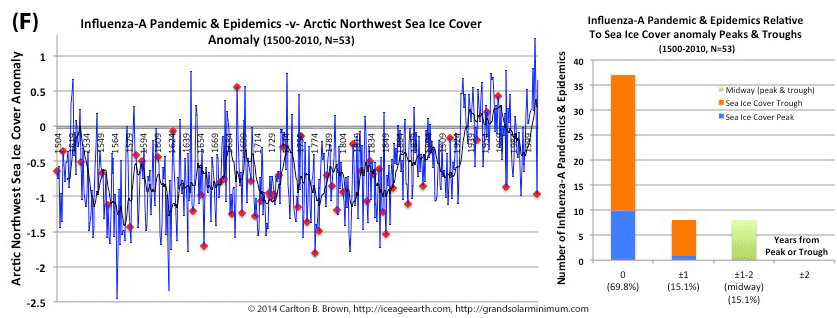
The majority (94%) of all pandemics since 1500 CE occurred when the proxy used to determine the Arctic sea ice cover was lower the 1961-1990 average. Sea ice cover is derived from measuring the growth of underwater algae (proxy). Lower levels of algae growth happens when it is colder and there is more sea ice blocking the sun’s penetration below the surface. Likewise, half of all pandemics occurred at a trough in this algae growth.[i] 

Click on this page and download a free copy of my book “Revolution: Ice Age Re-Entry,” and read more about this topic in Chapter 14—and find out why we should be very worried about a pandemic influenza outbreak this grand solar minimum.


[i] Data: (1) Jochen Halfar et al., 2013, Arctic sea-ice decline archived by multicentury annual-resolution record from crustose coralline algal proxy. Proceedings of the National Academy of Sciences. doi: 10.1073/pnas.1313775110. National Centers for Environmental Information, NESDIS, NOAA, U.S. Department of Commerce. Arctic Northwest Atlantic 646 Year Coralline Algae Sea Ice Record. https://www.ncdc.noaa.gov/paleo/study/15454. (2) Influenza pandemic and epidemic publications: (a) B. Lina, 2008, History of Influenza Pandemics. In: Raoult D., Drancourt M. (eds) Paleomicrobiology. Springer, Berlin, Heidelberg. https://doi.org/10.1007/978-3-540-75855-6_12. (b) E. Tognotti, 2009, Influenza pandemics: a historical retrospect. Journal of Infection in Developing Countries, 3:331-334. doi: https://doi.org/10.3855/jidc.239. (c) C. Potter, 2001, A history of influenza. Journal of Applied Microbiology, 91: 572-579. doi:10.1046/j.1365-2672.2001.01492.x. (d) J.K. Taubenberger and D.M. Morens, 1918 Influenza: the Mother of All Pandemics. Emerging Infectious Diseases. 2006;12(1):15-22. doi:10.3201/eid1201.050979. (e) Edwin D. Kilbourne, Influenza. Chapter 1; History of Influenza. Springer Science & Business Media, 6/12/2012 – Medical. ISBN 978-1-4684-5239-6. (f) Svenn-Erik Mamelund, Influenza, Historical. December 2008. International Encyclopedia of Public Health, First Edition (2008), vol. 3, pp. 597-609. DOI: 10.1016/B978-012373960-5.00372-5.

Pin It on Pinterest