by Carlton Brown | Jan 5, 2019 |
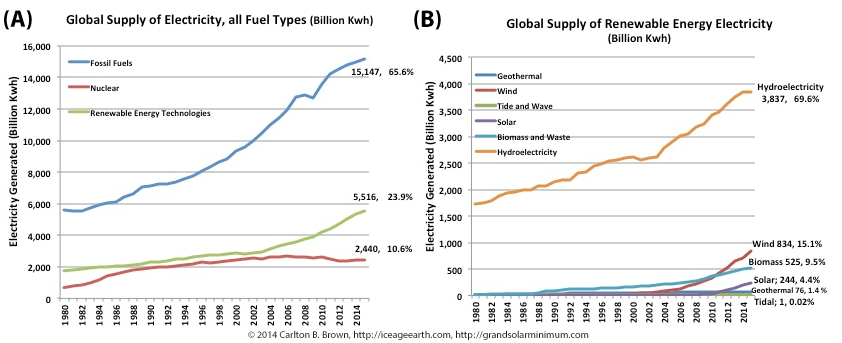
The market growth rates for renewable energy capacity building are too low to have a meaningful impact on switching the world’s energy system. This means unless something drastically changes we will not be able to meaningfully extend the world’s oil and gas reserve timelines, markedly reduce our fossil fuel pollution, or mitigate the natural climate change risks associated with this grand solar minimum while avoiding a future energy crisis. Clearly, the need to mitigate anthropogenic global warming is not the right marketing communications strategy.
To better understand the above paragraph, it is important to understand the above figure. In 2015 fossil fuels and nuclear energy supplied more than three-quarters of electricity generated. Between 1980 and 2015, these non-renewable energy sources supplied most of the growth in electricity generation (75 percent). In the last decade, non-hydroelectric generation by renewables has grown to account for 7.2 percent of global electricity generation, with hydroelectricity accounting for 16.6 percent. Electricity generation with renewables has shown a 10-year compounded annual growth rate of 5.3 percent, and non-hydroelectric renewables 16 percent. Wind, biomass, and solar sources of renewable energy are beginning to make an impact in the market,[iv] but their market growth rates are too slow to have a meaningful impact on the energy system switch in the short to medium term.
Therefore, something must change if we are to accelerate the energy system switch and mitigate important risks.
Pivotal to ensuring that a renewable energy switch moves ahead rapidly is the need to send the right messages about climate change, and provide the economic incentives that will motivate business and society as a whole to make changes. These messages must also convey the reality of our finite and dwindling energy and water reserves, and the damage we are doing (greenhouse gases, pollution) by using these resources. By refocusing the climate and resource messages governments can then engender the right sense of urgency and motivation for people and businesses to act and help switch the energy system to renewables.
Higher oil prices achieved through the perception of energy scarcity and the unveiling of catastrophic and natural climate change risks during this grand solar minimum will be a more powerful motivator for businesses, transportation, and industry generally (i.e., the largest energy users) to rapidly switch the energy system than the perceived need to mitigate anthropogenic global warming.
by Carlton Brown | Nov 19, 2018 |

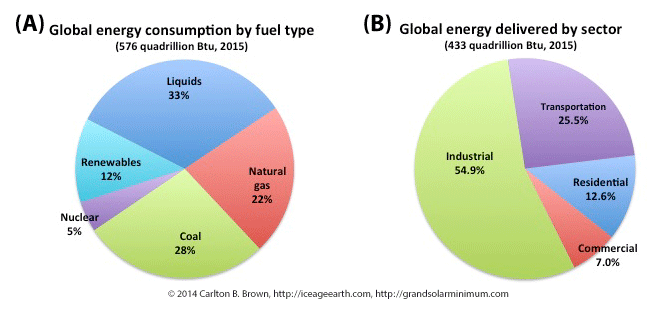
The world depends on non-renewable fossil and nuclear fuels for its primary sources of energy. Fossil fuels supply 83 percent of the world’s energy needs. More than 90 percent of energy consumption is accounted for by industrial, transportation, and residential use.[i]
The level and mix of energy use varies by sector and by country, depending on their stage of economic and technological development.[ii] At the macro level, liquid fuels, natural gas, and coal supply over 80 percent of energy consumed, with nuclear fuel and renewable energy accounting for the balance, as indicated in the figure above.
The global energy market consumes its supply of energy across the industrial, transportation, residential, and commercial sectors. Industrial use and transportation account for 80 percent of the energy consumed globally, making these two sectors important for a switch to renewable energy and the realization of fossil fuel savings.[iii]
Keys actions for the industrial sector to improve its energy efficiency and switch energy systems
The industrial sector is the largest global user of energy, consuming more than half of the energy supplied across all sectors. Heat and energy-intensive manufacturing processes consume most of this energy. This energy is used in the manufacture of food, steel and other metals, chemicals, in oil refining, and in pulp and paper production.
Principle areas for industrial action would include switching manufacturing processes to renewable energy for low temperature heating and cooling processes, and for fluid heating and steam generation processes. Switching to renewable energy systems for powering lighting and air temperature control systems inside buildings will also lead to significant fossil fuel savings.[iv]
Where heat is generated in industrial and manufacturing processes, energy recovery systems should be utilized to harness the dissipated or waste heat to improve overall energy efficiency.
Keys actions for the transport sector to improve its energy efficiency and switch energy systems
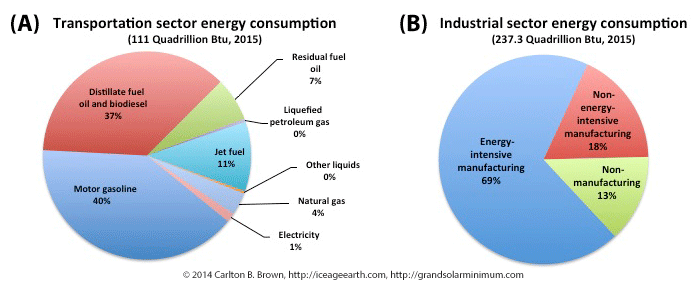
Figure A) Liquid fuels account for 95 percent of all fuels used in transportation, while natural gas and electricity account for the rest. B) Industry is the largest user of fossil fuel energy supplies, with energy-intensive manufacturing processes accounting for nearly 70 percent of industry’s total energy use.[v]
The transportation sector is the second-largest user of energy. More than half of the energy used by the transportation sector is in nations belonging to the Organization for Economic Co-operation and Development (OECD).[vi],[vii] However transportation in non-OECD nations is expected to dominate future growth in fuel use.[viii]
Passenger transportation accounts for nearly two-thirds of transportation fuel use, and freight transport for just over one-third. Light duty passenger transportation, air transportation, freight trucks, and shipping are the main users of energy within the transportation sector.[ix] All of these means of transport must come under scrutiny designed to find ways to improve their fuel use and efficiency. Reducing energy use and improving energy efficiency will require a general downsizing of engine capacities and reductions in vehicle weights.
Switching transportation to renewable energy systems is a priority, especially for passenger and freight transportation, as well as in cities and on the main intercity routes where most traffic occurs. The two main options for switching the transport sector to renewable energy sources are reviewed on another page.
[i] Data: International Energy Outlook 2017. Release Date: September 14, 2017, Report Number: DOE/EIA-0484(2017). Data extracted from. Table F1. Total world delivered energy consumption by end-use sector and fuel, Reference case, 2015-50. https://www.eia.gov/outlooks/ieo/excel/appf_tables.xlsx. Downloaded 06/04/2018.
[ii] U.S. Energy Information Administration (EIA). International Energy Outlook 2017. Release Date: September 14, 2017. Report Number: DOE/EIA-0484(2017). https://www.eia.gov/outlooks/ieo/pdf/industrial.pdf.
[iii] U.S. Energy Information Administration (EIA), Annual Energy Outlook 2017, DOE/EIA-0383(2017) (Washington, DC: January 2017). Data used; https://www.eia.gov/outlooks/ieo/excel/appf_tables.xlsx.
[iv] U.S. Energy Information Administration (EIA). International Energy Outlook 2017. Release Date: September 14, 2017. Report Number: DOE/EIA-0484(2017). https://www.eia.gov/outlooks/ieo/pdf/industrial.pdf.
[v] Data: Report: International Energy Outlook 2017. Release Date: September 14, 2017, Report Number: DOE/EIA-0484(2017). (1) Figure 9.3.A: Data extracted from. Table L1. Transportation sector energy consumption by region and fuel, Reference case, 2015-50. https://www.eia.gov/outlooks/ieo/excel/appl_tables.xlsx. Downloaded 06/04/2018. (2) Figure 9.3.B: Data extracted from. Table K1. Industrial sector energy consumption by region and sector, Reference case, 2015-50. https://www.eia.gov/outlooks/ieo/excel/appk_tables.xlsx. Downloaded 06/04/2018.
[vi] List of OECD Member countries – Ratification of the Convention on the OECD. http://www.oecd.org/about/membersandpartners/list-oecd-member-countries.htm.
[vii] U.S. Energy Information Administration (EIA). International Energy Outlook 2017. Release Date: September 14, 2017, Report Number: DOE/EIA-0484(2017). Data adapted from https://www.eia.gov/outlooks/ieo/excel/appl_tables.xlsx. Accessed 06/04/2018.
[viii] U.S. Energy Information Administration. Transportation sector energy consumption. Overview. International Energy Outlook 2016. https://www.eia.gov/outlooks/ieo/pdf/transportation.pdf. [See Overview on page 1 of 11 of Chapter 8].
[ix] U.S. Energy Information Administration. Transportation sector energy consumption. Overview. International Energy Outlook 2016. https://www.eia.gov/outlooks/ieo/pdf/transportation.pdf. [See Overview on page 4 and 5 of 11 of Chapter 8].
by Carlton Brown | Nov 19, 2018 |

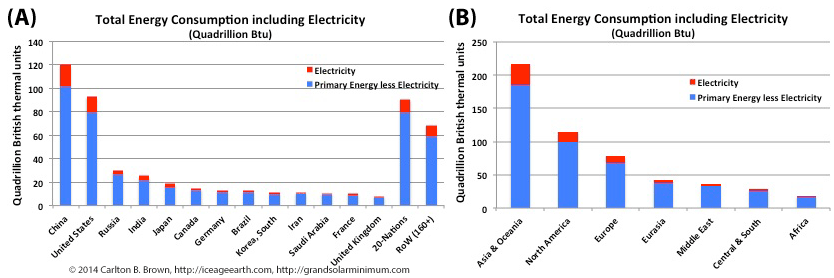
A small number of nations consume the majority of the world’s energy resources. Twelve nations are responsible for about 70 percent of the energy consumed, with China and the USA alone accounting for 40 percent. Twenty other nations consume a further 17 percent, leaving the rest of the world’s 160+ nations to consume 12.6 percent.[1] These 160+ nations’ are dependent on energy imports because they hold less than 4% of global fossil fuel energy reserves, which make them vulnerable to a future tightening of energy supplies.
In 2015, electricity delivered to the end-user accounted for 13.5 percent of world energy consumption. Staggeringly, of the 575 quadrillion BTU of energy consumed each year, 72 quadrillion British thermal units (BTU) were delivered as electricity, while 146 quadrillion BTUs (of that 575 quadrillion BTUs) were lost in the production of that electricity at the time of its generation.[2] Put another way, one-quarter of all energy consumed is wasted in the process of generating electricity, due to inefficiencies of converting energy to electricity.
Therefore, of all the initiatives that we can undertake to save fossil fuels and extend our energy reserve timelines (for today’s youth in tomorrow’s colder world), two strategic priorities stand out above all others. Firstly, if China, the USA, India, and other large industrial(izing) nations accelerated their nascent energy system switches, this would have a major impact on extending the lifetimes of world energy reserves. Secondly, rapidly switching electricity generation systems to renewable energy will have the biggest impact on extending the lifetimes of our fossil fuel reserves because this would save wasting one-quarter of global energy production each year to produce electricity. At the same time, making improvements in the efficiency of energy conversion into electricity, and the use of heat co-generation technologies in producing that electricity, would also save major amounts of energy.
[1] Data: Energy Information Administration: Primary energy and electricity consumption data were obtained from the International Energy Statistics data portal. World primary energy consumption by country (Quadrillion British thermal units, 1015 Btu), https://bit.ly/2xAB4sR. World electricity consumption by country (Billion Kwh) https://bit.ly/2J8TJ0t. Kilowatt hours (Kwh) were converted to British thermal units (Btu) using the 2015 conversion factor obtained from, https://www.eia.gov/energyexplained/index.php?page=about_btu. 1 kilowatt-hour = 3,412 Btu.
[2] Energy Information Administration. International Energy Outlook 2017. Release Date: September 14, 2017, Report Number: DOE/EIA-0484(2017). Data extracted from. Table F1. Total world delivered energy consumption by end-use sector and fuel, Reference case, 2015-50. https://www.eia.gov/outlooks/ieo/excel/appf_tables.xlsx. Downloaded 06/04/2018.
by Carlton Brown | Oct 19, 2018 |

Population and economic growth accelerates energy demand and more rapidly depletes proven fossil fuel and nuclear energy reserves.
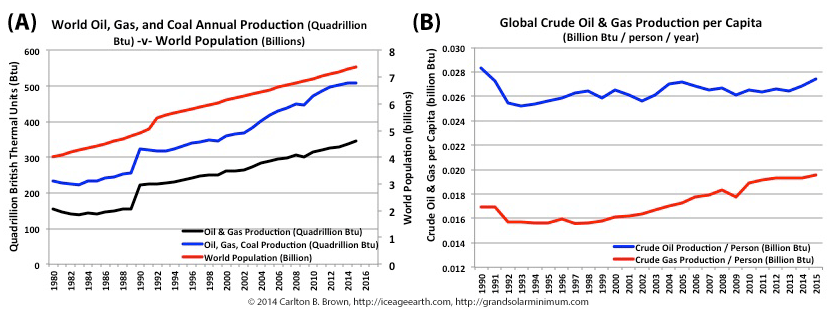
Figure A highlights that world population growth has tracked energy production growth over recent decades. The 3, 5, 10, and 20-year compound annual growth rates for oil and gas production have outpaced population growth rates, implying a growth in per capita consumption of energy resources. Figure B demonstrates that Humans are using more energy and especially more natural gas per capita, and this is a multi-decade trend.[i]
Between 1950 and 2017 the world’s population grew by 5 billion people, and every year the population continues to grow by 85 million people.[ii],[iii] This population growth is unrelenting, with 20-year and 3-year compound annual growth rates (i.e., year after year) broadly the same at 1.2 percent and 1.1 percent, respectively. Since 1980 most of this growth has occurred in Asia and Africa.[iv]
Economic growth and development has helped improve access to energy, food, and clean water, and thereby has played a major role in sustaining world population growth.[v],[vi] Population and economic growth have come at a price: the depletion of finite global resources and increased environmental destruction with little regard for the needs of future generations.
Under business as usual, it is expected there will be 9-plus billion people living in the world by 2050. Most of the population growth from current levels is expected to be in Asia and Africa,[vii],[viii],[ix],[x] which depend heavily on fossil fuel imports to achieve economic growth.
Population growth has tracked the growth in fossil fuel production since the early 1990s (see Figure A), and humans have been steadily increasing their energy consumption per capita during this period, especially for gas, thus accelerating the depletion of energy reserves. Population growth therefore accelerates energy demand and more rapidly depletes energy reserves.
[i] Data: (1) Figure 8.3.A: U.S. Energy Information Administration, International Data. World population statistics. https://bit.ly/2LF7Gom. (2) Figure 8.3.B: Oil, gas, and coal data was obtained from the Energy Information Administration from their International Energy Statistics data portal. This graphic utilizes the following data files. Natural gas https://bit.ly/2LC6GBo, Crude Oil https://bit.ly/2IWeEaP, Coal data https://bit.ly/2L6pk3w. Standard fuel units of energy (barrels, cubic feet, and short tons) were converted to British thermal units (Btu) using conversion factors obtained from, https://www.eia.gov/energyexplained/index.php?page=about_btu.
[ii] J. Cleland, “World Population Growth; Past, Present and Future.” Environ Resource Econ (2013) 55: 543. https://doi.org/10.1007/s10640-013-9675-6.
[iii] U.S. Energy Information Administration, International Data. World population statistics. https://bit.ly/2LF7Gom.
[iv] U.S. Energy Information Administration, International Data. World population statistics. https://bit.ly/2LF7Gom.
[v] Global Europe 2050. Directorate-General for Research and Innovation. 2012. Socio-economic Sciences and Humanities. EUR 25252.
[vi] J. Cleland, “World Population Growth; Past, Present and Future.” Environ Resource Econ (2013) 55: 543. https://doi.org/10.1007/s10640-013-9675-6.
[vii] Global Europe 2050. Directorate-General for Research and Innovation. 2012. Socio-economic Sciences and Humanities. EUR 25252.
[viii] Conduct a Google search, “United Nations, World population, 2050, 2100.”
[ix] J. Cleland, “World Population Growth; Past, Present and Future.” Environ Resource Econ (2013) 55: 543. https://doi.org/10.1007/s10640-013-9675-6.
[x] P. Gerland et al., “World Population Stabilization Unlikely This Century.” Science (New York, NY). 2014;346(6206):234-237. doi:10.1126/science.1257469.
by Carlton Brown | Oct 19, 2018 |

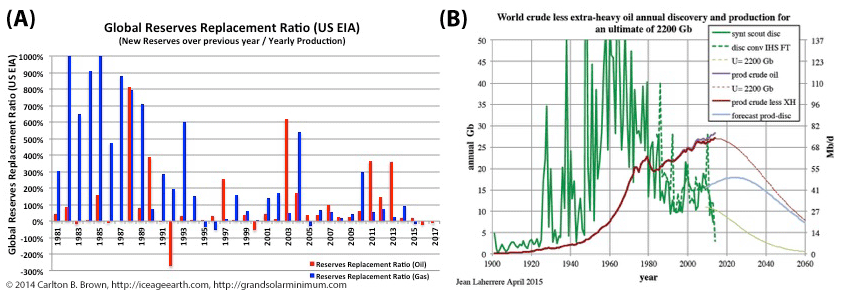
If cumulative oil and gas reserve growth was as strong as we are told (see Figure B), then why has the world Reserves Replacement ratio (i.e., newly discovered reserves to annual production ratio), as depicted in Figure A above, stood at less than 100 percent in 28 of the last 37 years? Moreover, in at least three of nine years (2011-2013)[i] with a reserves replacement ratio greater than 100 percent, upward revisions to reserves involved unproven reserve volumes (new prediction methodologies), not new discoveries, and these revisions were not backdated to the original wildcat discoveries.[ii] The world is therefore consuming more oil than is being discovered each year. Figure B above highlights new oil discoveries (green) versus world annual oil production (brown). This figure highlights that peak oil discovery occurred in the 1960s.[iii]
Oil and Gas Discoveries Peaked in the Past
Conventional oil discoveries peaked in the 1960s, with new yearly additions on average below annual production since the early 1980s (Figure A).[iv] Peak natural gas discovery took place between 1960 and 1980,[v] and we will now spend the decades ahead building pipelines and piping those gas reserves to markets.
In the USA, the lower 48 states peaked in oil and gas discovery in the 1930s, with production peaking in the early 1970s. The North Sea reduced the time lag between peak discovery and peak production from 40 years (i.e., as in the USA) to 27 years, meaning industry has become more efficient at depleting reserves (i.e., over a shorter timeframe).[vi]
The largest fields and reservoirs within a given area are typically discovered early on,[vii],[viii] and tend to provide most of the reserve growth.[ix],[x] No super-giant reservoirs containing more than 5 billion barrels of oil have been discovered in decades.[xi],[xii]
It is also recognized by experts that the easiest measures to increase oil recovery from existing fields and reservoirs have already been taken, meaning that more costly, enhanced oil recovery methods will be needed to increase extractions in the future.[xiii] This enhanced extraction will require a higher oil price.
Such is the state of oil and gas discovery that only one in four oil and one in three increases in gas reserves are actually coming from new discoveries.[xiv],[xv] Companies today are simply not discovering as much in new reserves as they are producing in energy,[xvi] which means that they are depleting their reserves (see Figure 8.2.A). This is reflected in the world oil reserves-to-replacement ratio being less than 100 percent for 28 of the last 37 years.
A giant field today holds more than 500 million barrels of oil, which is the equivalent of five days of global production.[xvii] In recent years, the size of discoveries has been significantly smaller than 500 million barrels.[xviii] The downturn in market price for oil in recent years highlights the sensitivity of exploration to oil price, as new oil discoveries have not been at such low levels since the 1940s.[xix],[xx],[xxi]
New discoveries are increasingly being made at greater depths on land, in deeper sea water subject to larger storms (e.g. Hurricane Katrina), and at greater distances from markets.[xxii],[xxiii],[xxiv] These more difficult operating environments and the higher costs involved will need oil and gas prices to recover substantially to make exploration and extraction economically viable.[xxv]
Unconventional oil and gas resources are touted as the saviors of the oil and gas industry, and are already supplying a significant share of today’s production,[xxvi] along with offshore supplies.[xxvii] These unconventional reserves are largely concentrated in North America, Russia, the OPEC nations, China, and South America.[xxviii] Market commentators have cautioned against being overly optimistic about shale prospects, because of the early falloff in production rates at US shale wells. This has necessitated concentrating oil recovery efforts in “sweet spots” until oil prices recover.[xxix]
When I reflect on all of the above concerning oil and gas reserves, the obvious questions are, first, has peak-oil discovery and production come and gone?[xxx] Is the inclusion of unproven reserves in calculations of world oil supply hiding the fact that peak oil is in fact behind us? And are market commentators’ attempts to move the discussion from peak oil and peak discovery to peak demand and the adequacy of supply similarly designed to mask the fact that we are running out of proven reserves?[xxxi] The answer is yes on all counts.
[i] U.S. Energy Information Administration. “Technically Recoverable Shale Oil and Shale Gas Resources. An Assessment of 137 Shale Formations in 41 Countries Outside the United States.” June 2013. [See Table 2, page 3].
[ii] Data: Oil, gas, and coal data was obtained from the Energy Information Administration from their International Energy Statistics data portal. This graphic utilizes the following data files. Natural gas https://bit.ly/2LC6GBo, Crude Oil https://bit.ly/2IWeEaP, Coal data https://bit.ly/2L6pk3w. Standard fuel units of energy (barrels, cubic feet, and short tons) were converted to British thermal units (Btu) using conversion factors obtained from, https://www.eia.gov/energyexplained/index.php?page=about_btu.
[iii] Jean Laherrère, Public domain, via Wikimedia Commons. Image description: Global oil discovery and production, showing peak discovery in the 1960s. March 1, 2015. https://commons.wikimedia.org/wiki/File:World_crude_discovery_production_U-2200Gb_LaherrereMar2015.jpg.
[iv] Ian Chapman, 2014, “The end of Peak Oil? Why this topic is still relevant despite recent denials.” Energy Policy, 64. 93-101. http://insight.cumbria.ac.uk/id/eprint/1708/.
[v] Harry J. Longwell, “The future of the oil and gas industry: past approaches, new challenges.” World Energy Volume 5 No. 3 2002.
[vi] Jack Zagar, “The End of Cheap “Conventional” Oil. Independent Petroleum Engineering Consultant. http://www.hubbertpeak.com/Zagar/hawaii/.
[vii] David F. Morehouse, “The Intricate Puzzle of Oil and Gas “Reserves Growth”.” Energy Information Administration. Natural Gas Monthly July 1997. http://large.stanford.edu/courses/2014/ph240/liegl1/docs/morehouse.pdf.
[viii] Kjell Aleklett and Colin J. Campbell, “The peak and decline of world oil and gas production.” Minerals and Energy-Raw Materials Report 18.1 (2003): 5-20.
[ix] T.A. Cook, 2013, “Reserve growth of oil and gas fields—Investigations and applications.” U.S. Geological Survey Scientific Investigations Report 2013–5063, 29 p., http://pubs.usgs.gov/sir/2013/5063/.
[x] David F. Morehouse, “The Intricate Puzzle of Oil and Gas “Reserves Growth”.” Energy Information Administration. Natural Gas Monthly July 1997. http://large.stanford.edu/courses/2014/ph240/liegl1/docs/morehouse.pdf.
[xi] R.G. Miller, S.R. Sorrell, 2014, “The future of oil supply.” Philosophical Transactions of the Royal Society A 372: 20130179. http://dx.doi.org/10.1098/rsta.2013.0179.
[xii] Robert L. Hirsch et al., “Peaking of World Oil Production: Impacts, Mitigation, and Risk Management.” February 2005. https://www.netl.doe.gov/publications/others/pdf/Oil_Peaking_NETL.pdf.
[xiii] M. Höök, 2014, “Depletion rate analysis of fields and regions: a methodological foundation.” Fuel, Volume 121, 1 April 2014, 95–108. http://dx.doi.org/10.1016/j.fuel.2013.12.024.
[xiv] David F. Morehouse, “The Intricate Puzzle of Oil and Gas “Reserves Growth”.” Energy Information Administration. Natural Gas Monthly July 1997. http://large.stanford.edu/courses/2014/ph240/liegl1/docs/morehouse.pdf.
[xv] T.A. Cook, 2013, “Reserve growth of oil and gas fields—Investigations and applications.” U.S. Geological Survey Scientific Investigations Report 2013–5063, 29 p., http://pubs.usgs.gov/sir/2013/5063/.
[xvi] “Financial Review of the Global Oil and Natural Gas Industry 2015.” Markets and Financial Analysis Team. May 2016. https://www.eia.gov/finance/review/archive/pdf/financial_2015.pdf.
[xvii] Data, U.S. Energy Information Administration. International_data. https://bit.ly/2Rw5hiM. [Worldwide production was 97,977,000 barrels per day in 2017.]
[xviii] “All-time low for discovered resources in 2017: Around 7 billion barrels of oil equivalent was discovered.” December 21, 2017. https://www.rystadenergy.com/newsevents/news/press-releases/all-time-low-discovered-resources-2017/.
[xix] “All-time low for discovered resources in 2017: Around 7 billion barrels of oil equivalent was discovered.” December 21, 2017. https://www.rystadenergy.com/newsevents/news/press-releases/all-time-low-discovered-resources-2017/.
[xx] “Declining Reserve Replacement Ratios Deceiving In Resource Play Environment.” November. 28, 2017. View Issue. Maurice Smith. JWN Energy. Daily Oil Bulletin. https://www.sproule.com/application/files/2415/1188/2978/Sproule-Declining-Reserve-Replacement-Ratios-Nora-Stewart-Steve-Golko.pdf.
[xxi] Tom Whipple, “Peak Oil Review” Originally published by ASPO-US. December 26, 2017. https://www.resilience.org/stories/2017-12-26/peak-oil-review-dec-26-2017/
[xxii] Harry J. Longwell, “The future of the oil and gas industry: past approaches, new challenges.” World Energy Volume 5 No. 3 2002.
[xxiii] James A. Baker III Institute For Public Policy of Rice University In Conjunction With a Program Co-Sponsored By Petroleum Industry Research Foundation No. 14, November 2000 http://large.stanford.edu/publications/power/references/baker/reports/docs/study_14.pdf.
[xxiv] Jack Zagar, “The End of Cheap “Conventional” Oil.” Independent Petroleum Engineering Consultant. http://www.hubbertpeak.com/Zagar/hawaii/.
[xxv] Rystad Energy Annual Review of World Oil Recoverable Resources: Saudi Arabia adds oil resources ahead of IPO June 20, 2017. https://www.rystadenergy.com/newsevents/news/press-releases/2017-annual-oil-recoverable-resource-review/.
[xxvi] Wang Hongjun et al., “Assessment of global unconventional oil and gas resources.” Petroleum Exploration and Development. 2016, 43(6): 925–940.
[xxvii] Rystad Energy Annual Review of World Oil Recoverable Resources: Saudi Arabia adds oil resources ahead of IPO June 20, 2017. https://www.rystadenergy.com/newsevents/news/press-releases/2017-annual-oil-recoverable-resource-review/.
[xxviii] Wang Hongjun et al., “Assessment of global unconventional oil and gas resources.” Petroleum Exploration and Development 2016, 43(6): 925–940.
[xxix] Tom Whipple, “Peak Oil Review” Originally published by ASPO-US. December 26, 2017. https://www.resilience.org/stories/2017-12-26/peak-oil-review-dec-26-2017/.
[xxx] Kjell Aleklett et al., “The Peak of the Oil Age: Analyzing the World Oil Production Reference Scenario in World Energy Outlook 2008.” Energy Policy, Volume 38, no. 3, Elsevier Ltd, 2010, 1398–1414, doi:10.1016/j.enpol.2009.11.021.
[xxxi] Peak oil demand and long-run oil prices. https://www.bp.com/en/global/corporate/energy-economics/spencer-dale-group-chief-economist/peak-oil-demand-and-long-run-oil-prices.html.

by Carlton Brown | Oct 19, 2018 |
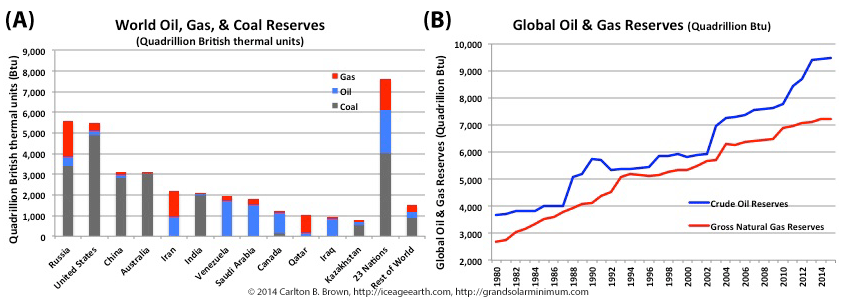
Ownership of the world’s fossil fuel resources is concentrated among a few nations, and state-owned oil and gas companies control most of these resources. The ownership of these energy reserves is detailed in the figure above. Moreover, we only have 50 years of proven oil and gas reserves left (see below) while 50 percent and 70 percent of the world’s oil and gas reserves are (respectively) in fact unproven guesstimates. This includes shale resources. The prospects for new oil and gas discoveries are not as bright as the promises made by the oil and gas industry might lead one to believe.

A Minority of Nations Control the World’s Oil and Gas Reserves
Ownership of the world’s fossil fuel resources is concentrated among a few nations, and state-owned oil and gas companies control most of these resources.[iv] Figure A above highlights that twelve nations hold three-quarters of the world’s fossil fuel energy reserves. Another group of 23 nations holds a further one-fifth of the world’s energy resources. This means the majority of nations (160+) hold only 4 percent of fossil fuel reserves. Figure B highlights a deception in the reporting of fossil fuel reserve data without backdating volume revisions to the original wildcat discovery. This market data deception creates a straight-line in cumulative reserve growth, similar to that depicted in Figure B above. This lack of backdating revisions means we miss the plateau that is occurring in the reserve growth rate.[i] [ii],[iii]
The world is dependent upon OPEC nations, Canada, Venezuela, Australia, and a small group of exporting nations from among the other major holders of reserves for much of its oil, gas, and coal needs. For example, just 20 nations supply 90-plus percent of the world’s oil and gas exports, while just five nations supply more than half of those exports.[v] Collectively this means that a minority of nations holds the majority of energy reserves, and an even smaller minority exports the lion’s share of the world’s fossil fuel supplies. This dependence on a minority of exporters will create vulnerabilities for fuel importers when a crisis arises.
Global Fossil Fuel Reserve Revisions Mean 50–70 Percent Are Unproven Guesstimates
The immutable laws of physics limit the maximum level of technical recoverability from a reservoir or field, to less than 50 percent for oil and 80 percent for gas.[vi],[vii] Once peak production has been reached, or approximately half a reservoir’s technically recoverable oil resources have been extracted, then production declines in a well understood manner.[viii],[ix]
Oil recovery happens in phases, and costs increase as technology is deployed. Primary oil recovery extracts the initial 10–30 percent, with secondary recovery methods permitting extraction levels of up to 30–50 percent. Most wells have already used secondary recovery methods for extraction (i.e., gas and water injection), but fewer have employed tertiary or enhanced oil recovery methods, due to complexity and cost.[x],[xi]
Technically recoverable resources represent the volumes of oil and gas that can be extracted with current technology and know-how. Proven reserves are a smaller subset of technically recoverable reserves with a greater than 90 percent certainty of being extracted. Unproven reserves are technically recoverable but are assigned either a 50 percent (probable) or 10 percent (possible) prospect of recovery, to reflect risk and uncertainty.[xii]
From the time production begins, reserve growth typically increases between 1.3- and 4.6-fold over the first 25 years.[xiii] These recoverable volume increases come from new well additions within a reservoir, increases in the field area, and new reservoir discoveries within the field, as well as the use of enhanced recovery techniques. Revisions to reserve estimates are a frequent occurrence.[xiv],[xv],[xvi],[xvii],[xviii]
With knowledge of the above, it becomes clear that all reserve estimates are subject to uncertainty. Governments, which own the majority of reserves, can have a significant influence on market perceptions about global reserves, while not being subject, as oil and gas companies are, to stock exchange reporting rules.[xix]
One such example of government influence on the market perception of reserve abundance occurred in 2013, when the US Energy Information Agency team increased its technically recoverable global reserve forecasts significantly by 11 percent and 47 percent for oil and gas resources, respectively, only two years after their 2011 forecast of reserves. These significant upward revisions reflected changes to the Energy Information Agency predictions of world unconventional energy resources i.e., shale oil and gas.
These revisions mean that one-third of the Energy Information Agency’s world gas and one-tenth of its world oil resource projections are for shale resources. These revisions also mean that between 50 percent and 70 percent of total conventional and unconventional oil and gas projections are classified as unproven (i.e., guesstimates).[xx] With such a high percentage being unproven, caution is required concerning the Energy Information Agency’s optimism.
It is also important to understand the forecasting methodologies and assumptions that are used. The 2013 revisions concerning oil and gas reserves were based on predictions involving the application of historic US shale oil and gas recovery rates to foreign petroliferous basins with similar geophysical characteristics. These revisions assumed the same operating context internationally as in the USA.[xxi]
In 2015, the U.S. Geological Survey attempted to manage market and public perceptions of the status of global energy reserves by significantly revising upwards its global estimates for conventional oil and gas reserves. These revisions were based on new prediction methodologies, assumptions about new technology deployment, and a supposedly greater understanding of reservoirs using desk-based research methods.[xxii] In other words, these were subjective assessments leading to significant upgrades of estimated reserves, which however lacked any physical validation of the reserves.
Experts remind us that over the long term, government forecasts have a tendency to overestimate reserves, and that reserves may not be adjusted downward despite years of production.[xxiii]
When Will We Run Out of Fossil Fuels?
By dividing the 2013 Energy Information Agency’s proven global oil, natural gas, and coal reserves by 2013 levels of production, without assuming any growth or a switch to a colder climate (thus accelerating energy demand), we’ve got 50 years of proven oil and gas reserves, and 130 years of coal reserves left.[xxiv],[xxv],[xxvi],[xxvii],[xxviii]
By including the more speculative unproven reserves,[xxix] not included in the Energy Information Agency’s reserve data,[xxx] while assuming a 50 percent certainty of recovery for those unproven reserves, then the reserve timelines can be extended from 50 to 75 years for oil and from 50 years to 117 years for natural gas. These extended reserve timelines do not factor in any population or economic growth, rendering these estimates “optimistic” to say the least.
The Nuclear Energy Agency and the International Atomic Energy Agency indicate that nuclear fuel reserve timelines are similar to that of coal, meaning that coal and nuclear fuels will run out at about the same time in the 22nd century.[xxxi]
With peak oil arguably behind us,[xxxii] with existing “reserves” comprised, to a great extent, of unproven resources, and with discoveries of new reserves declining, we need to be very cautious in thinking that there’s plenty of oil and gas still out there to be discovered. Clearly, supplier nations will simply not run out of energy resources overnight, but its prospect, when realized, will become a major economic force (i.e., oil price increases) for change in the future supply of energy.[xxxiii]
Investing in expensive oil exploration in difficult terrain (i.e., offshore, in the Arctic, deep in the earth), with exploration infrastructure facing more extreme weather (e.g., hurricanes), by an industry that is arguably trying to mask its decline phase, creates a less attractive context for long-term investment. Such a difficult context for oil and gas investment makes renewable energy investments more attractive, and undermines the promise inherent in the inflated, unproven estimates of oil and gas reserves.
[i] Data (for Figures 8.1.A and B): Oil, gas, and coal data was obtained from the Energy Information Administration from their International Energy Statistics data portal. This graphic utilizes the following data files. Natural gas https://bit.ly/2LC6GBo, Crude Oil https://bit.ly/2IWeEaP, Coal data https://bit.ly/2L6pk3w. Standard fuel units of energy (barrels, cubic feet, and short tons) were converted to British thermal units (Btu) using conversion factors obtained from, https://www.eia.gov/energyexplained/index.php?page=about_btu.
[ii] R.G. Miller, S.R. Sorrell, 2014, “The future of oil supply.” Philosophical Transactions of the Royal Society A 372: 20130179. http://dx.doi.org/10.1098/rsta.2013.0179.
[iii] Kjell Aleklett and Colin J. Campbell, “The peak and decline of world oil and gas production.” Minerals and Energy-Raw Materials Report 18.1 (2003): 5-20. (See the figure on page 6).
[iv] International Energy Forum. The IOCs And The NOCs In The Modern Energy Context. https://www.ief.org/news/the-iocs-and-the-nocs-in-the-modern-energy-context.
[v] Data: Energy Information Administration. Exports of Crude Oil including Lease Condensate. International Energy Statistics data portal. Based on 2016 data. Petroleum, https://bit.ly/2xfMwHM. Exports of Dry Natural Gas, https://bit.ly/2NhW6nK. Data accessed 16 September 2018.
[vi] The US Geological Survey reviewed oil recovery factors for USA oil and gas reservoirs, before applying this to their international oil and gas reserve forecasts (outside the USA). The mean modal recovery was 45% across 67 reservoirs. https://pubs.usgs.gov/sir/2015/5091/sir20155091.pdf.
[vii] Kjell Aleklett and Colin J. Campbell, “The peak and decline of world oil and gas production.” Minerals and Energy-Raw Materials Report 18.1 (2003): 5-20.
[viii] Ian Chapman, 2014, “The end of Peak Oil? Why this topic is still relevant despite recent denials.” Energy Policy, 64 . 93-101. http://insight.cumbria.ac.uk/id/eprint/1708/.
[ix] Kjell Aleklett and Colin J. Campbell, “The peak and decline of world oil and gas production.” Minerals and Energy-Raw Materials Report 18.1 (2003): 5-20.
[x] M. Höök, 2014, “Depletion rate analysis of fields and regions: a methodological foundation.” Fuel, Volume 121, 1 April 2014, 95–108. http://dx.doi.org/10.1016/j.fuel.2013.12.024.
[xi] Mahendra K. Verma, “The Reality of Reserve Growth. Reservoir Management.” U.S. Geological Survey. GEO ExPro October 2007 35.
[xii] US Energy Information Administration. “Oil and natural gas resource categories reflect varying degrees of certainty.” https://www.eia.gov/todayinenergy/detail.php?id=17151. (See the annotated diagram and descriptions for further explanation).
[xiii] Mahendra K. Verma, “The Reality of Reserve Growth. Reservoir Management.” U.S. Geological Survey. GEO ExPro October 2007 35.
[xiv] T.A. Cook, 2013, “Reserve growth of oil and gas fields—Investigations and applications.” U.S. Geological Survey Scientific Investigations Report 2013–5063, 29 p., http://pubs.usgs.gov/sir/2013/5063/.
[xv] https://energy.usgs.gov/OilGas/AssessmentsData/WorldPetroleumAssessment.aspx#3882215-overview. https://pubs.usgs.gov/sir/2015/5091/sir20155091.pdf .
[xvi] David F. Morehouse, “The Intricate Puzzle of Oil and Gas “Reserves Growth.” Energy Information Administration. Natural Gas Monthly July 1997. http://large.stanford.edu/courses/2014/ph240/liegl1/docs/morehouse.pdf.
[xvii] Mahendra K. Verma, “The Reality of Reserve Growth. Reservoir Management.” U.S. Geological Survey. GEO ExPro October 2007 35.
[xviii] T.R. Klett et al., 2015, U.S. “Geological Survey assessment of reserve growth outside of the United States.” U.S. Geological Survey Scientific Investigations Report 2015–5091,13 p., http://dx.doi.org/10.3133/sir20155091.
[xix] Kjell Aleklett and Colin J. Campbell, “The peak and decline of world oil and gas production.” Minerals and Energy-Raw Materials Report 18.1 (2003): 5-20.
[xx] U.S. Energy Information Administration. “Technically Recoverable Shale Oil and Shale Gas Resources.” An Assessment of 137 Shale Formations in 41 Countries Outside the United States. June 2013. [See Table 2, page 3. See pages 15-19, Methodology].
[xxi] U.S. Energy Information Administration. “Technically Recoverable Shale Oil and Shale Gas Resources.” An Assessment of 137 Shale Formations in 41 Countries Outside the United States. June 2013. [See pages 15-19, Methodology].
[xxii] See endnote 79.
[xxiii] Kjell Aleklett and Colin J. Campbell, “The peak and decline of world oil and gas production.” Minerals and Energy-Raw Materials Report 18.1 (2003): 5-20.
[xxiv] Data: Energy Information Administration data was obtained from: International Energy Statistics. These calculations utilized the following data files. Natural gas https://bit.ly/2LC6GBo, Crude Oil https://bit.ly/2IWeEaP, Coal data https://bit.ly/2L6pk3w. [Comment: These reserve timeline estimates were calculated by dividing the 2013 Energy Information Agency’s proven global oil, natural gas, and coal reserves by the 2013 levels of production. This calculation tells us there are 50 years of proven oil and gas, and 130 years of coal reserves left. These reserve timeline estimates do not assume any population or economic growth, or a switch to a cold climate regime, which would accelerate energy demand and reduce timelines.].
[xxv] See endnote 78.
[xxvi] See endnote 75.
[xxvii] See endnote 76.
[xxviii] Ian Chapman, 2014, “The end of Peak Oil? Why this topic is still relevant despite recent denials.” Energy Policy, 64 . 93-101. http://insight.cumbria.ac.uk/id/eprint/1708/
[xxix] U.S. Energy Information Administration. Technically Recoverable Shale Oil and Shale Gas Resources. An Assessment of 137 Shale Formations in 41 Countries Outside the United States. June 2013. [See Table 2, page 3 for this data].
[xxx] Data: Oil, gas, and coal data was obtained from the Energy Information Administration from their International Energy Statistics data portal. This graphic utilizes the following data files: Natural gas https://bit.ly/2LC6GBo, Crude Oil https://bit.ly/2IWeEaP, Coal data https://bit.ly/2L6pk3w. Standard fuel units of energy (barrels, cubic feet, and short tons) were converted to British thermal units (Btu) using conversion factors obtained from, https://www.eia.gov/energyexplained/index.php?page=about_btu.
[xxxi] “Uranium 2016: Resources, Production and Demand.” NEA No. 7301, OECD 2016. A Joint Report by the Nuclear Energy Agency and the International Atomic Energy Agency.
[xxxii] Kjell Aleklett et al., “The Peak of the Oil Age: Analyzing the World Oil Production Reference Scenario in World Energy Outlook 2008.” Energy Policy, Volume 38, no. 3, Elsevier Ltd, 2010, 1398–1414, doi:10.1016/j.enpol.2009.11.021.
[xxxiii] Kjell Aleklett et al., “The Peak of the Oil Age: Analyzing the World Oil Production Reference Scenario in World Energy Outlook 2008.” Energy Policy, Volume 38, no. 3, Elsevier Ltd, 2010, 1398–1414, doi:10.1016/j.enpol.2009.11.021.


Recent Comments