It is impossible to know what happened to the global surface temperature between 1850/1880 and 2020 utilizing the global surface temperature indices provided by NASA, National Oceanic and Atmospheric Administrations (NOAA), and the MetOffice, without access to the raw data. This situation arises because all current temperature indices have been majorly altered over earlier versions, which is evidenced by subtracting the old from the new versions. These index version changes had the effect of increasing the warming rate and absolute temperature increase from 1900 to 2020 while giving the impression that 2020 was broadly on par with or exceeded an artificially diminished 2016 peak temperature.
Data Sources: see the data hyperlinks in the table below. This data was provided and altered by NASA, National Oceanic and Atmospheric Administration (NOAA), and the UK MetOffice.
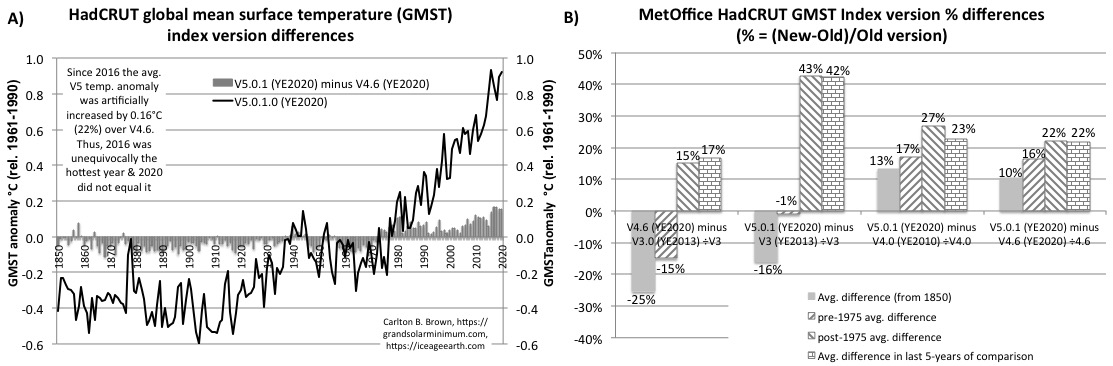
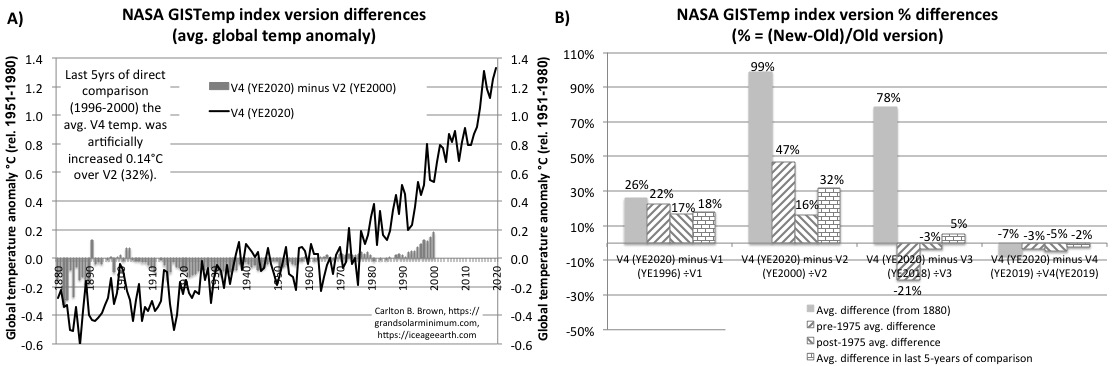
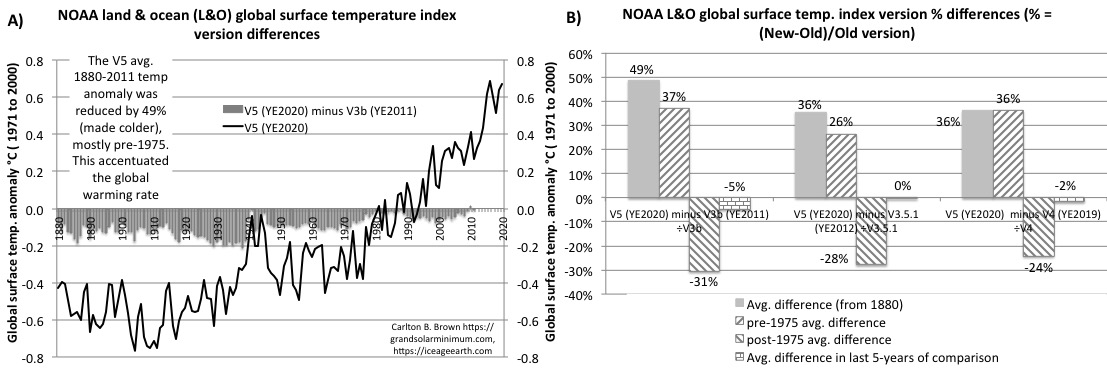
Figure legend: Version differences for MetOffice NASA, and NOAA global mean surface temperature indices (current versus predecessors). Subtracting the older index version from the current version revealed the differences. Annual global temperature anomaly differences were averaged by period groupings into start-to-end, pre-1975 and post-1975, and the last 5-years. The period grouping percentage differences were calculated (%={new version minus old version} /divided by old version). A positive percentage before 1975 meant an increased cooling, while a positive percentage after 1975 meant increased warming. A negative percentage before 1975 meant a reduced cooling, while a negative percentage after 1975 meant reduced warming.
When HadCRUT current V5.0.1 (YE2020) version was compared with its predecessor V4.6 (YE2020), V4.0 (YE2010), and V3 (YE2013) versions; the post-1975 average temperature anomaly (rel. 1961-1990) was increased by 22%-43%, and the last 5-years of direct comparison were increased by 22%-42% (made warmer) over the earlier versions. The pre-1975 average temperature anomaly was reduced by 16-17% (made colder) for V5.0.1 over the V4.6 and V4.0 versions. The largest warming increases were observed between V5.0.1 over V3 for the post-1975 period (43%) and the last 5-years of comparison (42%, 2009-2013). These post-1975 changes had the effect of making 2020 broadly on par with the prior 2016 peak global temperature.
NASA’s current V4 version (YE2020) average temperature anomaly (1880-to-end, rel.1951-1980) increased by 99% over V2 (YE2000, made colder), 78% over V3 (YE2018, made warmer), and by 26% over V1 (YE1996, made colder). The largest version differences were observed between V4 (YE2020) over V2 (YE2000) across all comparator periods (16%-99%). The average 1880-to-end difference increased by 99% (made colder), the pre-1975 was reduced by 47% (made colder), while the last 5-years of direct comparison saw the V4 warming increase by 32% (1996-2000). NASA’s V4 (YE2020) adjustments over its V4 (YE2019) version also reduced the 2016 peak temperature anomaly from 1.33°C to 1.31°C, reduced the 2019 temperature anomaly from 1.28°C to 1.25°C, thus making 2020 the hottest year (1.33°C), which usurped an artificially diminished 2016 peak temperature in the hottest temperature rankings.
NOAA’s current V5 version (YE2020) average anomaly (1880-to-end, rel.1971-2000) increased by 36-49% over the V4 (YE2019), V3.5.1 (YE2012), and V3b (YE2011) versions (made colder in all cases) with most of the change occurring pre-1975 (26-37%). NOAA’s V5 (YE2020) adjustments also increased the temperature anomaly in 2019 by 0.03°C (5%) over V4 (YE2019), while reducing the 2016 peak temperature 0.02°C. These changes made 2020 broadly on par with a diminished 2016 global peak temperature in the hottest temperature rankings.
Recent Comments