by Carlton Brown | Dec 8, 2018 |

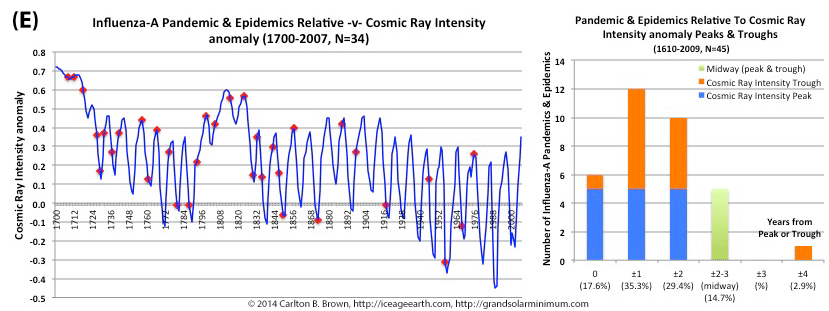
Low solar activity, typical of grand solar minimum periods, is associated with increased cosmic ray intensity levels and more pandemic influenza outbreaks. The majority (80%) of pandemics since 1700 took place when the cosmic ray intensity (CRI) level was above the average for the 1961-1990 period. This corresponded with a phase of relatively low solar activity and numerous grand solar minimum periods. Additonally, during this three century period more than half of pandemics occurred at or within one year of a peak or trough in cosmic ray intensity levels. Cosmic ray intensity anomaly and pandemic flu outbreaks are highlighted in the figure above (Figure C).[i]
Cosmic rays that enter earth’s atmosphere from space represent a well-established proxy for determining solar activity (see the citation for details).[ii] In addition to sunspot numbers, total solar irradiance, and Beryllium-10, the cosmic ray intensity offers a fourth solar activity parameter associated with pandemic influenza outbreaks. Four different solar activity parameters all showing peak and trough associations with pandemic outbreaks add strong support to the hypothesis that solar activity extremes portend increased risk for pandemic influenza outbreaks.
Click on this page and download a free copy of my book “Revolution: Ice Age Re-Entry,” and read more about this topic in Chapter 14—and why we should be very worried about a pandemic influenza outbreak this grand solar minimum.
[i] Data: (1) Usoskin, I.G., et al. 2008. Cosmic Ray Intensity Reconstruction. IGBP PAGES/World Data Center for Paleoclimatology. Data Contribution Series # 2008-013. NOAA/NCDC Paleoclimatology Program, Boulder CO, USA. Original References: 1) I.G. Usoskin et al., 2002, A physical reconstruction of cosmic ray intensity since 1610. Journal of Geophysical Research, 107(A11), 1374. Downloaded May 2018. ftp://ftp.ncdc.noaa.gov/pub/data/paleo/climate_forcing/solar_variability/usoskin-cosmic-ray.txt. (2) Influenza pandemic and epidemic publications: (a) B. Lina, 2008, History of Influenza Pandemics. In: Raoult D., Drancourt M. (eds) Paleomicrobiology. Springer, Berlin, Heidelberg. https://doi.org/10.1007/978-3-540-75855-6_12. (b) E. Tognotti, 2009, Influenza pandemics: a historical retrospect. Journal of Infection in Developing Countries, 3:331-334. doi: https://doi.org/10.3855/jidc.239. (c) C. Potter, 2001, A history of influenza. Journal of Applied Microbiology, 91: 572-579. doi:10.1046/j.1365-2672.2001.01492.x. (d) J.K. Taubenberger and D.M. Morens, 1918 Influenza: the Mother of All Pandemics. Emerging Infectious Diseases. 2006;12(1):15-22. doi:10.3201/eid1201.050979. (e) Edwin D. Kilbourne, Influenza. Chapter 1; History of Influenza. Springer Science & Business Media, 6/12/2012 – Medical. ISBN 978-1-4684-5239-6. (f) Svenn-Erik Mamelund, Influenza, Historical. December 2008. International Encyclopedia of Public Health, First Edition (2008), vol. 3, pp. 597-609. DOI: 10.1016/B978-012373960-5.00372-5.
[ii] I.G.M. Usoskin et al., “Solar activity, cosmic rays, and Earth’s temperature: A millennium-scale comparison.” Journal of Geophysical Research, 110, A10102, doi:10.1029/2004JA010946. [Exposé: See page 1. This tells us cosmogenic isotopes (Beryllium-10, Carbon-14) are used as proxies for solar activity, and that their production is caused by galactic cosmic ray flux, which is influenced by the solar system’s (heliospheric) magnetic field and is modulated by solar activity. Comment: Magnetized solar wind modulates the solar system’s magnetic shield (i.e., the heliosphere) and the earth’s magnetic shield (i.e. the magnetosphere), thereby regulating cosmic ray entry into the solar system and the earth system respectively. Cosmic ray entry into the upper atmosphere from space is modulated by solar activity and geomagnetism. Lower solar activity and lower geomagnetism permit more cosmic ray entry into the atmosphere, and conversely. Increased cosmic ray levels are associated with increased low-cloud formation, which is associated with planetary cooling, and conversely. The cosmic ray and low-cloud cooling effect are concentrated into the polar regions. Cosmogenic isotopes (Carbon-14, Beryllium-10) are generated by cosmic rays in the atmosphere, with more cosmic rays generating more cosmogenic isotopes, and conversely. Cosmogenic isotopes are then embedded in earth repositories (i.e., tree rings, ice cores) and therefore indirectly tell us about solar activity and the resulting magnetized solar wind that contacts the earth’s magnetosphere. By utilizing cosmogenic isotopes to assess relationships between the sun and earth systems (i.e., climate, volcanism) we know that the solar activity that is being assessed is magnetism based, and not electromagnetism (i.e. not solar irradiance).].
by Carlton Brown | Dec 8, 2018 |

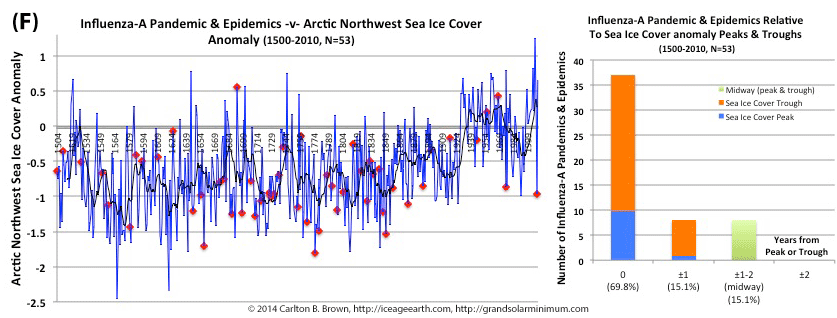
The majority (94%) of all pandemics since 1500 CE occurred when the proxy used to determine the Arctic sea ice cover was lower the 1961-1990 average. Sea ice cover is derived from measuring the growth of underwater algae (proxy). Lower levels of algae growth happens when it is colder and there is more sea ice blocking the sun’s penetration below the surface. Likewise, half of all pandemics occurred at a trough in this algae growth.[i]
Click on this page and download a free copy of my book “Revolution: Ice Age Re-Entry,” and read more about this topic in Chapter 14—and find out why we should be very worried about a pandemic influenza outbreak this grand solar minimum.
[i] Data: (1) Jochen Halfar et al., 2013, Arctic sea-ice decline archived by multicentury annual-resolution record from crustose coralline algal proxy. Proceedings of the National Academy of Sciences. doi: 10.1073/pnas.1313775110. National Centers for Environmental Information, NESDIS, NOAA, U.S. Department of Commerce. Arctic Northwest Atlantic 646 Year Coralline Algae Sea Ice Record. https://www.ncdc.noaa.gov/paleo/study/15454. (2) Influenza pandemic and epidemic publications: (a) B. Lina, 2008, History of Influenza Pandemics. In: Raoult D., Drancourt M. (eds) Paleomicrobiology. Springer, Berlin, Heidelberg. https://doi.org/10.1007/978-3-540-75855-6_12. (b) E. Tognotti, 2009, Influenza pandemics: a historical retrospect. Journal of Infection in Developing Countries, 3:331-334. doi: https://doi.org/10.3855/jidc.239. (c) C. Potter, 2001, A history of influenza. Journal of Applied Microbiology, 91: 572-579. doi:10.1046/j.1365-2672.2001.01492.x. (d) J.K. Taubenberger and D.M. Morens, 1918 Influenza: the Mother of All Pandemics. Emerging Infectious Diseases. 2006;12(1):15-22. doi:10.3201/eid1201.050979. (e) Edwin D. Kilbourne, Influenza. Chapter 1; History of Influenza. Springer Science & Business Media, 6/12/2012 – Medical. ISBN 978-1-4684-5239-6. (f) Svenn-Erik Mamelund, Influenza, Historical. December 2008. International Encyclopedia of Public Health, First Edition (2008), vol. 3, pp. 597-609. DOI: 10.1016/B978-012373960-5.00372-5.
by Carlton Brown | Nov 19, 2018 |

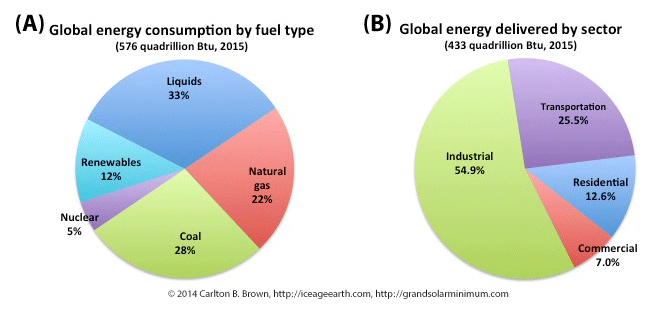
The world depends on non-renewable fossil and nuclear fuels for its primary sources of energy. Fossil fuels supply 83 percent of the world’s energy needs. More than 90 percent of energy consumption is accounted for by industrial, transportation, and residential use.[i]
The level and mix of energy use varies by sector and by country, depending on their stage of economic and technological development.[ii] At the macro level, liquid fuels, natural gas, and coal supply over 80 percent of energy consumed, with nuclear fuel and renewable energy accounting for the balance, as indicated in the figure above.
The global energy market consumes its supply of energy across the industrial, transportation, residential, and commercial sectors. Industrial use and transportation account for 80 percent of the energy consumed globally, making these two sectors important for a switch to renewable energy and the realization of fossil fuel savings.[iii]
Keys actions for the industrial sector to improve its energy efficiency and switch energy systems
The industrial sector is the largest global user of energy, consuming more than half of the energy supplied across all sectors. Heat and energy-intensive manufacturing processes consume most of this energy. This energy is used in the manufacture of food, steel and other metals, chemicals, in oil refining, and in pulp and paper production.
Principle areas for industrial action would include switching manufacturing processes to renewable energy for low temperature heating and cooling processes, and for fluid heating and steam generation processes. Switching to renewable energy systems for powering lighting and air temperature control systems inside buildings will also lead to significant fossil fuel savings.[iv]
Where heat is generated in industrial and manufacturing processes, energy recovery systems should be utilized to harness the dissipated or waste heat to improve overall energy efficiency.
Keys actions for the transport sector to improve its energy efficiency and switch energy systems
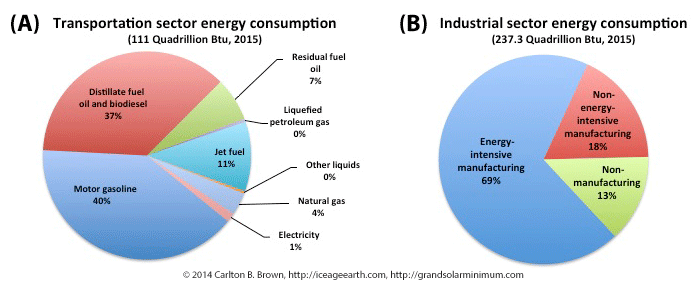
Figure A) Liquid fuels account for 95 percent of all fuels used in transportation, while natural gas and electricity account for the rest. B) Industry is the largest user of fossil fuel energy supplies, with energy-intensive manufacturing processes accounting for nearly 70 percent of industry’s total energy use.[v]
The transportation sector is the second-largest user of energy. More than half of the energy used by the transportation sector is in nations belonging to the Organization for Economic Co-operation and Development (OECD).[vi],[vii] However transportation in non-OECD nations is expected to dominate future growth in fuel use.[viii]
Passenger transportation accounts for nearly two-thirds of transportation fuel use, and freight transport for just over one-third. Light duty passenger transportation, air transportation, freight trucks, and shipping are the main users of energy within the transportation sector.[ix] All of these means of transport must come under scrutiny designed to find ways to improve their fuel use and efficiency. Reducing energy use and improving energy efficiency will require a general downsizing of engine capacities and reductions in vehicle weights.
Switching transportation to renewable energy systems is a priority, especially for passenger and freight transportation, as well as in cities and on the main intercity routes where most traffic occurs. The two main options for switching the transport sector to renewable energy sources are reviewed on another page.
[i] Data: International Energy Outlook 2017. Release Date: September 14, 2017, Report Number: DOE/EIA-0484(2017). Data extracted from. Table F1. Total world delivered energy consumption by end-use sector and fuel, Reference case, 2015-50. https://www.eia.gov/outlooks/ieo/excel/appf_tables.xlsx. Downloaded 06/04/2018.
[ii] U.S. Energy Information Administration (EIA). International Energy Outlook 2017. Release Date: September 14, 2017. Report Number: DOE/EIA-0484(2017). https://www.eia.gov/outlooks/ieo/pdf/industrial.pdf.
[iii] U.S. Energy Information Administration (EIA), Annual Energy Outlook 2017, DOE/EIA-0383(2017) (Washington, DC: January 2017). Data used; https://www.eia.gov/outlooks/ieo/excel/appf_tables.xlsx.
[iv] U.S. Energy Information Administration (EIA). International Energy Outlook 2017. Release Date: September 14, 2017. Report Number: DOE/EIA-0484(2017). https://www.eia.gov/outlooks/ieo/pdf/industrial.pdf.
[v] Data: Report: International Energy Outlook 2017. Release Date: September 14, 2017, Report Number: DOE/EIA-0484(2017). (1) Figure 9.3.A: Data extracted from. Table L1. Transportation sector energy consumption by region and fuel, Reference case, 2015-50. https://www.eia.gov/outlooks/ieo/excel/appl_tables.xlsx. Downloaded 06/04/2018. (2) Figure 9.3.B: Data extracted from. Table K1. Industrial sector energy consumption by region and sector, Reference case, 2015-50. https://www.eia.gov/outlooks/ieo/excel/appk_tables.xlsx. Downloaded 06/04/2018.
[vi] List of OECD Member countries – Ratification of the Convention on the OECD. http://www.oecd.org/about/membersandpartners/list-oecd-member-countries.htm.
[vii] U.S. Energy Information Administration (EIA). International Energy Outlook 2017. Release Date: September 14, 2017, Report Number: DOE/EIA-0484(2017). Data adapted from https://www.eia.gov/outlooks/ieo/excel/appl_tables.xlsx. Accessed 06/04/2018.
[viii] U.S. Energy Information Administration. Transportation sector energy consumption. Overview. International Energy Outlook 2016. https://www.eia.gov/outlooks/ieo/pdf/transportation.pdf. [See Overview on page 1 of 11 of Chapter 8].
[ix] U.S. Energy Information Administration. Transportation sector energy consumption. Overview. International Energy Outlook 2016. https://www.eia.gov/outlooks/ieo/pdf/transportation.pdf. [See Overview on page 4 and 5 of 11 of Chapter 8].
by Carlton Brown | Nov 19, 2018 |

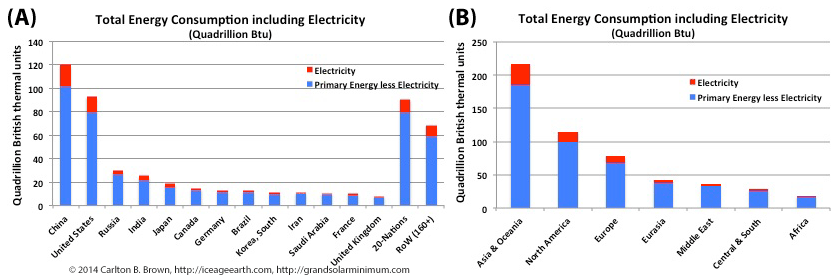
A small number of nations consume the majority of the world’s energy resources. Twelve nations are responsible for about 70 percent of the energy consumed, with China and the USA alone accounting for 40 percent. Twenty other nations consume a further 17 percent, leaving the rest of the world’s 160+ nations to consume 12.6 percent.[1] These 160+ nations’ are dependent on energy imports because they hold less than 4% of global fossil fuel energy reserves, which make them vulnerable to a future tightening of energy supplies.
In 2015, electricity delivered to the end-user accounted for 13.5 percent of world energy consumption. Staggeringly, of the 575 quadrillion BTU of energy consumed each year, 72 quadrillion British thermal units (BTU) were delivered as electricity, while 146 quadrillion BTUs (of that 575 quadrillion BTUs) were lost in the production of that electricity at the time of its generation.[2] Put another way, one-quarter of all energy consumed is wasted in the process of generating electricity, due to inefficiencies of converting energy to electricity.
Therefore, of all the initiatives that we can undertake to save fossil fuels and extend our energy reserve timelines (for today’s youth in tomorrow’s colder world), two strategic priorities stand out above all others. Firstly, if China, the USA, India, and other large industrial(izing) nations accelerated their nascent energy system switches, this would have a major impact on extending the lifetimes of world energy reserves. Secondly, rapidly switching electricity generation systems to renewable energy will have the biggest impact on extending the lifetimes of our fossil fuel reserves because this would save wasting one-quarter of global energy production each year to produce electricity. At the same time, making improvements in the efficiency of energy conversion into electricity, and the use of heat co-generation technologies in producing that electricity, would also save major amounts of energy.
[1] Data: Energy Information Administration: Primary energy and electricity consumption data were obtained from the International Energy Statistics data portal. World primary energy consumption by country (Quadrillion British thermal units, 1015 Btu), https://bit.ly/2xAB4sR. World electricity consumption by country (Billion Kwh) https://bit.ly/2J8TJ0t. Kilowatt hours (Kwh) were converted to British thermal units (Btu) using the 2015 conversion factor obtained from, https://www.eia.gov/energyexplained/index.php?page=about_btu. 1 kilowatt-hour = 3,412 Btu.
[2] Energy Information Administration. International Energy Outlook 2017. Release Date: September 14, 2017, Report Number: DOE/EIA-0484(2017). Data extracted from. Table F1. Total world delivered energy consumption by end-use sector and fuel, Reference case, 2015-50. https://www.eia.gov/outlooks/ieo/excel/appf_tables.xlsx. Downloaded 06/04/2018.
by Carlton Brown | Oct 19, 2018 |

Population and economic growth accelerates energy demand and more rapidly depletes proven fossil fuel and nuclear energy reserves.
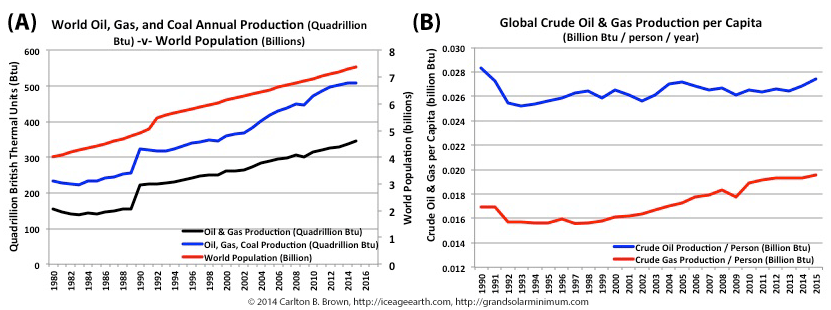
Figure A highlights that world population growth has tracked energy production growth over recent decades. The 3, 5, 10, and 20-year compound annual growth rates for oil and gas production have outpaced population growth rates, implying a growth in per capita consumption of energy resources. Figure B demonstrates that Humans are using more energy and especially more natural gas per capita, and this is a multi-decade trend.[i]
Between 1950 and 2017 the world’s population grew by 5 billion people, and every year the population continues to grow by 85 million people.[ii],[iii] This population growth is unrelenting, with 20-year and 3-year compound annual growth rates (i.e., year after year) broadly the same at 1.2 percent and 1.1 percent, respectively. Since 1980 most of this growth has occurred in Asia and Africa.[iv]
Economic growth and development has helped improve access to energy, food, and clean water, and thereby has played a major role in sustaining world population growth.[v],[vi] Population and economic growth have come at a price: the depletion of finite global resources and increased environmental destruction with little regard for the needs of future generations.
Under business as usual, it is expected there will be 9-plus billion people living in the world by 2050. Most of the population growth from current levels is expected to be in Asia and Africa,[vii],[viii],[ix],[x] which depend heavily on fossil fuel imports to achieve economic growth.
Population growth has tracked the growth in fossil fuel production since the early 1990s (see Figure A), and humans have been steadily increasing their energy consumption per capita during this period, especially for gas, thus accelerating the depletion of energy reserves. Population growth therefore accelerates energy demand and more rapidly depletes energy reserves.
[i] Data: (1) Figure 8.3.A: U.S. Energy Information Administration, International Data. World population statistics. https://bit.ly/2LF7Gom. (2) Figure 8.3.B: Oil, gas, and coal data was obtained from the Energy Information Administration from their International Energy Statistics data portal. This graphic utilizes the following data files. Natural gas https://bit.ly/2LC6GBo, Crude Oil https://bit.ly/2IWeEaP, Coal data https://bit.ly/2L6pk3w. Standard fuel units of energy (barrels, cubic feet, and short tons) were converted to British thermal units (Btu) using conversion factors obtained from, https://www.eia.gov/energyexplained/index.php?page=about_btu.
[ii] J. Cleland, “World Population Growth; Past, Present and Future.” Environ Resource Econ (2013) 55: 543. https://doi.org/10.1007/s10640-013-9675-6.
[iii] U.S. Energy Information Administration, International Data. World population statistics. https://bit.ly/2LF7Gom.
[iv] U.S. Energy Information Administration, International Data. World population statistics. https://bit.ly/2LF7Gom.
[v] Global Europe 2050. Directorate-General for Research and Innovation. 2012. Socio-economic Sciences and Humanities. EUR 25252.
[vi] J. Cleland, “World Population Growth; Past, Present and Future.” Environ Resource Econ (2013) 55: 543. https://doi.org/10.1007/s10640-013-9675-6.
[vii] Global Europe 2050. Directorate-General for Research and Innovation. 2012. Socio-economic Sciences and Humanities. EUR 25252.
[viii] Conduct a Google search, “United Nations, World population, 2050, 2100.”
[ix] J. Cleland, “World Population Growth; Past, Present and Future.” Environ Resource Econ (2013) 55: 543. https://doi.org/10.1007/s10640-013-9675-6.
[x] P. Gerland et al., “World Population Stabilization Unlikely This Century.” Science (New York, NY). 2014;346(6206):234-237. doi:10.1126/science.1257469.


Recent Comments