Glacier ice build up peaked during the Little Ice Age

Glacier ice build up peaked during the Little Ice Age

Arctic and Antarctic glacier ice build up began about 5,000 years ago after the Holocene Climate Optimum. Significant glacier advances occurred in many regions between the first and twelfth centuries CE, and more rapidly accumulated during the Little Ice Age (13th to 19th centuries). Much of this glacier ice melted after the mid-19th century as the sun entered its grand solar maximum phase.

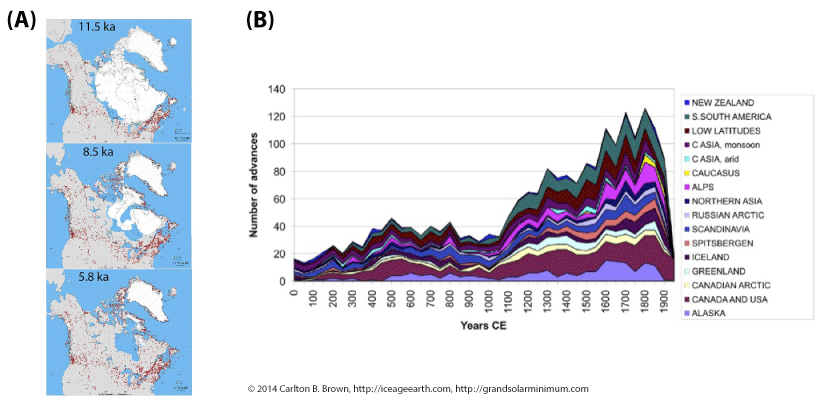
Part A) of the image presents three smaller images (from 15) extracted from a time series of the Laurentide and Greenland ice sheets during the Holocene. The complete time series shows a stepwise reduction in ice extent from 11,500 years ago to its minimum extent 5,800 years ago.[1] B) A stacked time series of glacier advances and retractions during the last two millennia. A small number of glacier advances occurred in many regions between the first and twelfth centuries CE. There was a sharp increase in the number of glacier advances from the 13th century to the mid-19th century, after which glaciers started to recede.[2]


The Arctic has more ice today than at the Holocene Climate Optimum

More generally, the Arctic’s Holocene Climate Optimum occurred between 8,000 and 5,000 years ago, varying regionally in onset. Temperatures were in general two to four degrees Celsius higher than today.[3],[4],[5]

Greenland’s ice sheet margins retreated to less than their extent today between seven and four thousand years ago,[6] reaching their minimum extent between five and three thousand years ago.[7] The zone of coastal ice melt in the Arctic also retreated five hundred kilometers farther north, and there were summers free of sea ice.[8]

After the climate optimum, ice began to accumulate once again. This is evidenced by an abrupt ice accumulation along Greenland’s north coast starting 5,500 years ago; northeast Greenland was ice-locked by about 3,000 years ago.[9] In Greenland’s southeast, today’s Kulusuk glacier region had been ice-free during the climate optimum. Then, between 4,100 and 1,300 years ago, there were six major glacial advances, which coincided with major cooling episodes in the North Atlantic Ocean.[10]

The number of glacial advances in the second millennium CE was greater than in the first millennium, with most of the geographically widespread and extensive advances taking place during the Little Ice Age between the 13th and mid-19th centuries (see Figure 3.4B).[11] During this time winter sea ice closed off previously accessible sea routes between Scandinavia and Greenland.[12]

Beginning in the mid-19th century, as temperatures increased again, glacier ice began to melt, with this accelerating over the past five decades.[13],[14],[15]

Antarctica has more ice today than at the Holocene Climate Optimum

During the last glacial maximum, about 20,000 years ago, some parts of the Antarctic ice sheet reached the continental shelf edge.[16],[17] Initial ice retreat from the last glacial maximum was under way by between 17,000 and 14,000 years ago, and between 10,000 and 8,000 years ago melting extended into Antarctica’s interior, with deglaciation continuing until about 5,000 years ago.[18]

A widespread early Holocene Climate Optimum took place between 11,500 and 9,000 years ago, with a secondary optimum between 8,000 and 5,000 years ago. By 5,000 years ago most of the Antarctic glaciers had retreated to, or behind, their current positions.[19] During Antarctica’s climate optimum the central interior domes of the ice sheet were actually about one hundred meters lower than today, telling us there was less ice than exists today.[20]

During the last eight centuries Antarctica’s ice mass has waxed and waned. Periods of high ice accumulation occurred during the last millennia, most notably between the 14th and early 17th centuries, coinciding with the Little Ice Age. Since the 1960s ice accumulation has increased in the high coastal regions and over the highest part of east Antarctica.[21]

Click on this page and download a free copy of my book “Revolution: Ice Age Re-Entry,” and read more about this topic in Chapter 3.


[1]      Jason P. Briner et al., “Holocene climate change in Arctic Canada and Greenland.” Quaternary Science Reviews, Volume 147, 2016, 340-364, ISSN 0277-3791. https://doi.org/10.1016/j.quascirev.2016.02.010.

[2]      O.N. Solomina et al., 2016, “Glacier fluctuations during the past 2000 years.” Quaternary Science Reviews, 149, 61-90. DOI: 10.1016/j.quascirev.2016.04.008. [See Figure 5, page 276. This figure collates a stacked time series of the number of glacier advances and recessions in each region into a global total.].

[3]      Nicolaj K. Larsen et al., “The response of the southern Greenland ice sheet to the Holocene thermal maximum.” Geology ; 43 (4): 291–294. doi: https://doi.org/10.1130/G36476.1.

[4]      D.S. Kaufman et al., “Holocene thermal maximum in the western Arctic (0–1800W).” Quaternary Science Reviews 23 (2004) 529–560.

[5]      J.P. Briner et al., “Holocene climate change in Arctic Canada and Greenland.” Quaternary Science Reviews (2016), http://dx.doi.org/10.1016/j.quascirev.2016.02.010.

[6]      Nicolaj K. Larsen et al., “The response of the southern Greenland ice sheet to the Holocene thermal maximum.” Geology ; 43 (4): 291–294. doi: https://doi.org/10.1130/G36476.1.

[7]      J.P. Briner et al., “Holocene climate change in Arctic Canada and Greenland.” Quaternary Science Reviews (2016), http://dx.doi.org/10.1016/j.quascirev.2016.02.010.

[8]      Leonid Polyak et al., “History of sea ice in the Arctic.” Quaternary Science Reviews 29 (2010) 1757–1778, https://doi.org/10.1016/j.quascirev.2010.02.010.

[9]      Leonid Polyak et al., “History of sea ice in the Arctic.” Quaternary Science Reviews 29 (2010) 1757–1778, https://doi.org/10.1016/j.quascirev.2010.02.010.

[10]    N. L. Balascio et al., “Glacier response to North Atlantic climate variability during the Holocene.” Climate of the Past, 11, 1587-1598, https://doi.org/10.5194/cp-11-1587-2015, 2015.

[11]    O. N. Solomina et al., 2016, “Glacier fluctuations during the past 2000 years.” Quaternary Science Reviews, 149, 61-90. DOI: 10.1016/j.quascirev.2016.04.008. [See Figure 5, page 276. This figure collates a stacked time series of the number of glacier advances and recessions in each region into a global total.].

[12]    Michael E Mann, “Little Ice Age.” Volume 1, The Earth system: physical and chemical dimensions of global environmental change, 504–509. In Encyclopedia of Global Environmental Change (ISBN 0-471-97796-9).

[13]    Leonid Polyak et al., “History of sea ice in the Arctic.” Quaternary Science Reviews 29 (2010) 1757–1778, https://doi.org/10.1016/j.quascirev.2010.02.010

[14]    Christophe Kinnard et al., “A changing Arctic seasonal ice zone: Observations from 1870–2003 and possible oceanographic consequences.” Geophysical Research Letters, Volume 35, L02507, doi:10.1029/2007GL032507, 2008.

[15]    O.N. Solomina et al., 2016, “Glacier fluctuations during the past 2000 years.” Quaternary Science Reviews, 149, 61-90. DOI: 10.1016/j.quascirev.2016.04.008. [See Figure 5, page 276. This figure collates a stacked time series of the number of glacier advances and recessions in each region into a global total.].

[16]    A.N. Mackintosh et al., 2014, “Retreat history of the East Antarctic Ice Sheet since the Last Glacial Maximum.” Quaternary Science Reviews 100, 10e30. http://dx.doi.org/10.1016/j.quascirev.2013.07.024.

[17]    The RAISED Consortium1, Michael J. Bentley et al. “A community-based geological reconstruction of Antarctic Ice Sheet deglaciation since the Last Glacial Maximum.” Quaternary Science Reviews. Volume 100, 15 September 2014, 1-9.

[18]    Ó. Ingólfsson et al., 1998, “Antarctic glacial history since the Last Glacial Maximum: An overview of the record on land.” Antarctic Science, 10(3), 326-344. doi:10.1017/S095410209800039X.

[19]    Ó. Ingólfsson et al., 1998, “Antarctic glacial history since the Last Glacial Maximum: An overview of the record on land. “Antarctic Science, 10(3), 326-344. doi:10.1017/S095410209800039X.

[20]    The RAISED Consortium1, Michael J. Bentley et al. “A community-based geological reconstruction of Antarctic Ice Sheet deglaciation since the Last Glacial Maximum.” Quaternary Science Reviews. Volume 100, 15 September 2014, 1-9.

[21]    M. Frezzotti1 et al., “A synthesis of the Antarctic surface mass balance during the last 800 years.” The Cryosphere, 7, 303–319, 2013. www.the-cryosphere.net/7/303/2013/doi:10.5194/tc-7-303-2013. [See Figure 5.A, 312.].
Abrupt global cooling happens after extreme global warming phases

Abrupt global cooling happens after extreme global warming phases

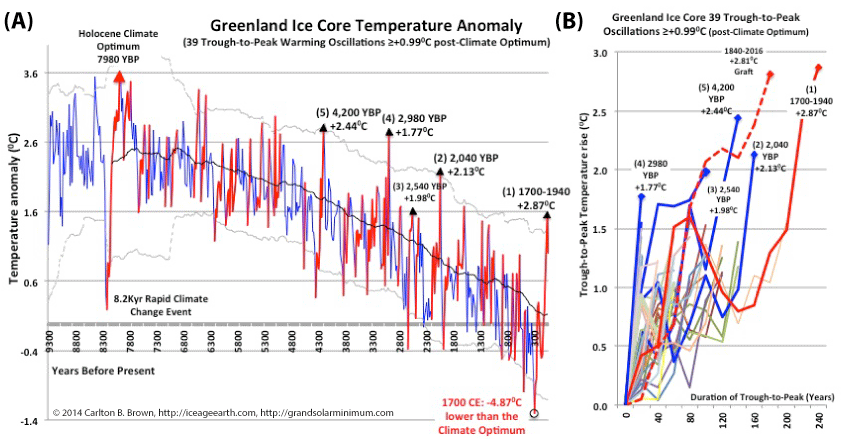
Extreme Arctic warming phases switch abruptly to Arctic cooling phases. The 1700-2016 Arctic warming phase was the most extreme since the Holocene Climate Optimum. After the Arctic’s climate optimum the temperature declined 4.860C by 1700. This decline took place in a oscillatory manner over centennial timescales. These climate oscillations comprised 39 temperature increases exceeding 0.990C (trough-to-peak phases, range 1–15 decades, mean 88 years), which were followed by temperature declines exceeding 0.990C (peak-to-tough phases, range 1–10 decades, mean 76 years), among smaller temperature oscillations.

A) Thirty-nine trough-to-peak temperature rises exceeding 0.990C (red segments) between 7980 years ago and 1960 were extracted from the Greenland ice core for analysis. To help visualize statistical outliers, upper/lower Bollinger bands (pale grey) are used to highlight the peaks and troughs falling outside two standard deviations (95% confidence limits relative to a 60-period moving average, black line). The 39 trough-to-peak rises (warming phases) were not normally distributed and were therefore stratified into two groups (Group 2 ≤ 1.770C and Group 1 ≥ 1.770C) based on goodness-of-fit and outlier tests. The outlier test highlighted that those peaks rising more than 1.770C were significant outliers, and that the 2.870C rise from 1700-1940 was the biggest outlier or most extreme warming phase. This stratification yielded two normally distributed groups that were significantly different from one another. B) This figure graphically displays the 39 trough-to-peak warming phases (rebased) plus a grafted peak +2.810C (1840-2016 CE). Group 1 outliers are blue and red (extreme outliers), while Group 2 comprise all non-blue/red lines.[i]

Based on this above comparative analysis of extracted trough-to-peak temperature rises, or warming phases, I conclude that there is a greater probability the ice core temperature will decline than continue its rise through the rest of the 21st century.

Outlier Arctic warming phases fall abruptly after the climate switches to a cooling phase

A further statistical analysis of the above Groups 1 and 2 Arctic warming phases was conducted. This analysis shows that when the climate switches, the temperature decline is deeper and more abrupt with the Group 1 outliers than with Group 2.

Groups 1 and 2 were compared for their magnitude of temperature decline, and the time taken to reach the first post-peak and the final temperature troughs. Group 1 (the big outlier warming peaks) dropped rapidly to its maximum decline of 1.920C within 40 years, whereas Group 2 declined 1.030C in a similar timeframe. This difference in temperature decline was statistically significant (see the citation).[ii]

Some of the Arctic’s coldest periods, biggest glacier advances, and important rapid cooling events since the Holocene Climate Optimum are included in Group 1 (see previous citation’s table for the years involved).[iii],[iv],[v] Group 1 also includes the 4.2 kiloyear rapid climate change event associated with the extreme drought that precipitated the fall of Ancient Egypt’s Old Kingdom, the Akkadian Empire, and the Indus Valley Culture.

The conclusion I drew from this analysis is the bigger the trough-to-peak phase, the greater the magnitude of temperature drop and the more abruptly it falls from peak-to-trough after the peak (i.e., within 40 years). The implication for this current 1700-2016 warming phase is that the climate will switch back to a cooling phase, and the temperature will decline sharply.

Click on this page and download a free copy of my book “Revolution: Ice Age Re-Entry,” and read more about this topic in Chapter 4.


[i]       Data: (1) B.M. Vinther et al., 2009, “Holocene thinning of the Greenland ice sheet.” Nature, Vol. 461, pp. 385-388, 17 September 2009. National Centers for Environmental Information, NESDIS, NOAA, U.S. Department of Commerce. Greenland Ice Sheet Holocene d18O, Temperature, and Surface Elevation. doi:10.1038/nature08355. https://www.ncdc.noaa.gov/paleo-search/study/11148. Downloaded 05/05/2018. (2) HadCRUT4 near surface temperature data set for the Northern Hemisphere. http://www.metoffice.gov.uk/hadobs/hadcrut4/data/current/download.html. Downloaded 25 July 2018. Personal Research: All 39 climate trough-to-peak temperature rises exceeding +0.990C, between 5980 BCE and 1940 CE were extracted from the temperature data, derived from the Greenland ice core, for group analysis (range, +0.990C to +2.870C, average 77.4 years trough-to-peak, n=39). These trough-to-peak temperature increases selected trough-to-peaks to start from the deepest time point in the maximum trough preceding the tallest peak. A goodness-of-fit test of all 39 trough-to-peak temperature rises showed that the data did not follow a normal distribution. This indicates the possibility that more than one global warming process may be involved with the bigger climate oscillation outliers (i.e., an extreme grand solar maxima). Results: Prior to stratifying the data an Iglewicz and Hoaglin’s robust test (two-sided test) for multiple outliers was performed using a modified Z score of ≥1.5 and ≥5 as the outlier criteria. The modified Z score of ≥1.5 highlighted significant outliers above +1.770C. A higher modified Z score of ≥5 yielded the most extreme outlier the +2.870C trough-to-peak between 1700 and 1940. Given the outliers that were revealed, the data was stratified into two groups (0.990C – 1.770C or ≥ 1.770C). This stratification yielded 2 normally distributed groups (Group-1, N=5, Group-2 N=34), that were, statistically, significantly different from one another (unpaired Welch T-Test, 2-tailed P-value = 0.007). Group 1’s smallest temperature rise was 0.210C greater than Group 2’s largest temperature rise, highlighting the gap between the two groups. On the basis of the above, the peak-to-trough temperature rise from 1700 to 1940 (+2.870C) was confirmed as the most significant outlier. This process was repeated for the grafted peak from 1840-2016 (+2.810C) as detailed in Figure 4.1. Group-1 swapped the +2.870C with the +2.810C, which was also statistically, significantly different from Group-2 (unpaired Welch T-Test, two-sided P-value = 0.0061). Conclusion: Group-1 (N=5) composed of trough-to-peak outliers ≥ 1.770C were significantly larger global warmings than Group-2 (N=34), and the +2.870C or +2.810C were the largest outliers.

[ii]       Data: (1) B.M. Vinther et al., 2009, “Holocene thinning of the Greenland ice sheet.” Nature, Vol. 461, pp. 385-388, 17 September 2009. National Centers for Environmental Information, NESDIS, NOAA, U.S. Department of Commerce. Greenland Ice Sheet Holocene d18O, Temperature, and Surface Elevation. doi:10.1038/nature08355. https://www.ncdc.noaa.gov/paleo-search/study/11148. Downloaded 05/05/2018. Personal Research: Groups 1 and 2 (previous citation) were compared by their magnitudes of decline from the temperature peak to see if there was a difference between them once the climate switched to a cooling phase. The time to reach the first post-peak trough, and to their maximum troughs was calculated. Each group had a normal distribution (d’Agostino-Pearson test and Shapiro-Wilks test: P>0.05) but a different variance. As such a Welch T-test (unpaired) was used to assess group differences. Results: Group 1 (≥1.770C trough-to-peak) showed a mean temperature decline at the 1st trough after the peak of 1.920C versus Group 2’s (≤1.770C trough-to-peak) mean temperature decline of 1.030C, which represented a statistically significant difference in temperature decline over Group 1 (2-tailed P-value = 0.0433). Group 1 showed a mean temperature decline at the maximum trough after the peak of 1.920C versus Group 2’s mean temperature decline of 1.230C, but this difference was not significantly different (-0.690C, P-value 0.0784). Moreover, Group 1 rapidly declined such that its first post-peak trough was the same as its maximum trough i.e., Group 1 temperature fell abruptly. Group 2 showed a difference between its first and maximum trough of -0.200C, which was significantly different (P-value = 0.001928). Group 1 took two intervals (i.e., 45 years) to drop -1.920C with its first and maximum trough being the same (-1.920C). By contrast, Group 2 took on mean 1.82 intervals (i.e., 36 years) to reach its first trough and 3.15 intervals (i.e., 63 years) to reach its deepest trough. Conclusion: The higher the preceding trough-to-peak temperature rise (statistical outlier, or tall temperature peaks) the greater and more abrupt the temperature falls to near its maximum trough when the climate switches.

[iii]      Olga N. Solomina et al., “Holocene glacier fluctuations.” Quaternary Science Reviews. Volume 111, 2015, 9-34. https://doi.org/10.1016/j.quascirev.2014.11.018.

[iv]      C. Andersen et al., “A highly unstable Holocene climate in the subpolar North Atlantic: evidence from diatoms.” Quaternary Science Reviews, Volume 23, Issues 20–22, 2004, 2155-2166. https://doi.org/10.1016/j.quascirev.2004.08.004.

[v]       H. Wanner et al., “Structure and origin of Holocene cold events.” Quaternary Science Reviews (2011), doi:10.1016/j.quascirev.2011.07.010.

Slowest ice age entry temperature decline in two million years

Slowest ice age entry temperature decline in two million years

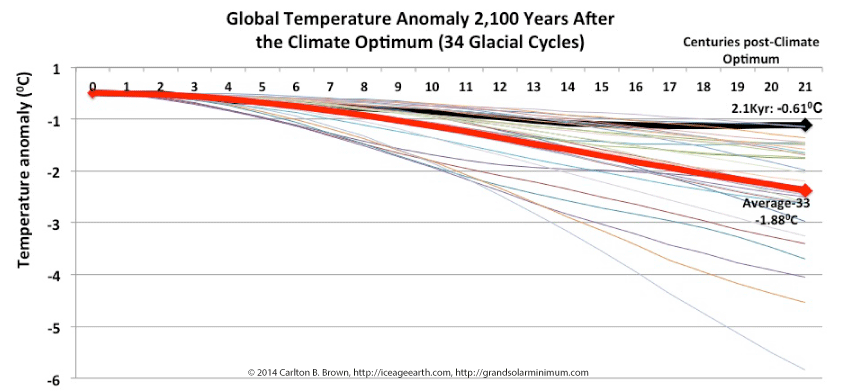
This ice age entry after the Holocene Climate Optimum is the slowest of to decline in temperature compared with all 33 previous glacial cycles in the last 2 million years (global data). If the climate system has a tendency to revert to the mean, then a significant global cooling will occur during the 21st century.

The first 2,100 years of temperature data after a climate optimum was extracted for the last 34 glacial cycles, and was rebased to zero degrees and zero time. The temperature declined by 0.610C after the Holocene Climate Optimum, which was 1.260C above the average of all other glacial cycles in 2,026,800 years (global data).[i]

The temperature decline 2,100 years after the Holocene Climate Optimum (global data) is the smallest decline compared with all 33 previous glacial cycles 2,100 years after their respective climate optima, in the past 2,026,800 years. While this current global ice age inception temperature decline is the biggest outlier (i.e., slowest to cool), it is not a statistically significant outlier (i.e., P-value >0.05).

The above-cited data suggests that if the climate system has a tendency to revert to the mean, then a significant global cooling will occur during the 21st century.

Click on this page and download a free copy of my book “Revolution: Ice Age Re-Entry,” and read more about this topic in Chapter 3.


[i]       Data: R. Bintanja and R.S.W. van de Wal, “North American ice-sheet dynamics and the onset of 100,000-year glacial cycles.” Nature, Volume 454, 869-872, 14 August 2008. doi:10.1038/nature07158. National Centers for Environmental Information, NESDIS, NOAA, U.S. Department of Commerce. Global 3Ma Temperature, Sea Level, and Ice Volume Reconstructions. https://www.ncdc.noaa.gov/paleo-search/study/11933. Downloaded 10/27/2015. Personal Research: The temperature data for the first 2,100 years from the climate optimum was extracted for the last 34 glacial cycles. This temperature time-series was rebased to zero degrees and zero time so all glacial cycles could be compared on the same basis, i.e., from their peaks. The temperature declined by 0.610C after the Holocene Climate Optimum, which was 1.260C above the average of all other glacial cycles in 2,026,800 years. The current glacial cycle’s slow decline was not a significant outlier in the group.

Slowest ice age entry temperature decline in 800,000 years (Antarctica)

Slowest ice age entry temperature decline in 800,000 years (Antarctica)

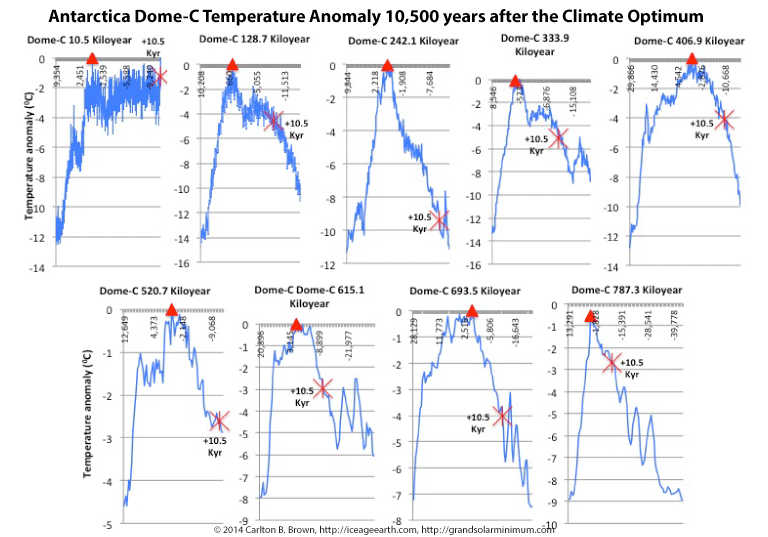
This ice age entry after the Holocene Climate Optimum is the slowest of to decline in temperature compared with all eight previous glacial cycles in the last 800,000 years (Antarctica). If the Antarctic climate system has a tendency to revert to the mean, then it will undergo a significant cooling during the 21st century.

Ice core temperature data from Antarctica’s EPICA Dome C reveals that the temperature has only declined by 1.20C (top left figure) since the Holocene Climate Optimum 10,527 years ago. The comparator group of all eight previous glacial cycles declined on average by 4.30C, 10,500 years after their respective climate optima (red triangle shapes).

The temperature decline since the Holocene Climate Optimum 10,500 years after the Antarctic’s Holocene Climate Optimum is the smallest decline compared with all glacial cycles in the past 800,000 years.[i] While this current Antarctic ice age inception temperature decline is the biggest outlier (i.e., slowest to cool), it is not a statistically significant outlier (i.e., P-value >0.05).

This data analysis suggests that if the climate system has a tendency to revert to the mean, then Antarctica will undergo a significant cooling phase during the 21st century.

Click on this page and download a free copy of my book “Revolution: Ice Age Re-Entry,” and read more about this topic in Chapter 3.


[i]       J.V. Jouzel et al., 2007, “Orbital and Millennial Antarctic Climate Variability over the Past 800,000 Years.” Science, Volume 317, No. 5839, 793-797, 10 August 2007. National Centers for Environmental Information, NESDIS, NOAA, U.S. Department of Commerce. EPICA Dome C – 800KYr Deuterium Data and Temperature Estimates. https://www.ncdc.noaa.gov/paleo/study/6080. Download data: Downloaded 08/02/2016.

A glacial cycle is comprised of sequential freeze-thaw phases

A glacial cycle is comprised of sequential freeze-thaw phases

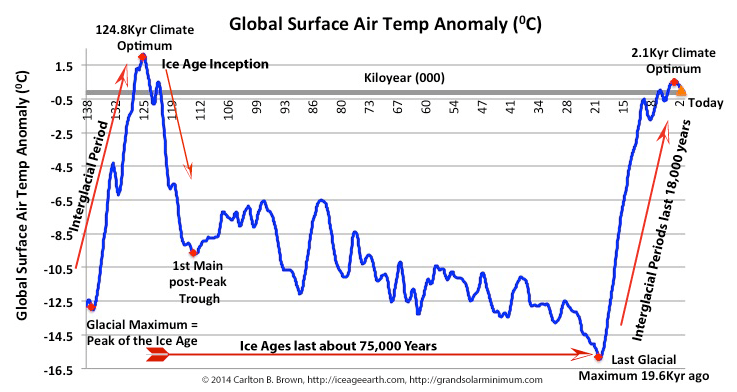
During the last 1 million years the average glacial cycle has lasted for 92,900 years, the average interglacial period was 18,200 years long, and the interglacial temperature rose on average 13.50C (global data). The average glacial period, or period of freezing, lasted about 74,700 years, from the climate optimum to the next glacial maximum.[i]

Each glacial cycle displays recurring phases and common points of reference such as a climate optimum, a glacial maximum, an interglacial period, and a first main trough after the climate optimum. Interglacial periods are warming phases that extend from the glacial maximum (i.e., peak of the ice age) to the climate optimum. The glacial maximum represents the lowest temperature of the glacial cycle, during which the maximum ice mass and lowest sea levels exist. A climate optimum represents the highest temperature period of the glacial cycle at the end of the interglacial period, during which ice mass is at its lowest and sea level is at its highest. Ice ages start after the climate optimum.

Click on this page and download a free copy of my book “Revolution: Ice Age Re-Entry,” and read more about this topic in Chapter 3.


[i]       Bintanja, R. and R.S.W. van de Wal, “North American ice-sheet dynamics and the onset of 100,000-year glacial cycles.” Nature, Volume 454, 869-872, 14 August 2008. doi:10.1038/nature07158. National Centers for Environmental Information, NESDIS, NOAA, U.S. Department of Commerce. Global 3Ma Temperature, Sea Level, and Ice Volume Reconstructions. https://www.ncdc.noaa.gov/paleo-search/study/11933. Downloaded 10/27/2015.

Pin It on Pinterest