Slowest ice age entry temperature decline in two million years

Slowest ice age entry temperature decline in two million years

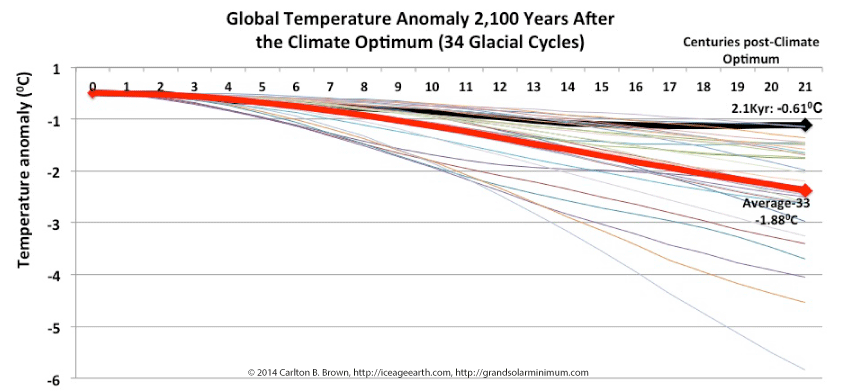
This ice age entry after the Holocene Climate Optimum is the slowest of to decline in temperature compared with all 33 previous glacial cycles in the last 2 million years (global data). If the climate system has a tendency to revert to the mean, then a significant global cooling will occur during the 21st century.

The first 2,100 years of temperature data after a climate optimum was extracted for the last 34 glacial cycles, and was rebased to zero degrees and zero time. The temperature declined by 0.610C after the Holocene Climate Optimum, which was 1.260C above the average of all other glacial cycles in 2,026,800 years (global data).[i]

The temperature decline 2,100 years after the Holocene Climate Optimum (global data) is the smallest decline compared with all 33 previous glacial cycles 2,100 years after their respective climate optima, in the past 2,026,800 years. While this current global ice age inception temperature decline is the biggest outlier (i.e., slowest to cool), it is not a statistically significant outlier (i.e., P-value >0.05).

The above-cited data suggests that if the climate system has a tendency to revert to the mean, then a significant global cooling will occur during the 21st century.

Click on this page and download a free copy of my book “Revolution: Ice Age Re-Entry,” and read more about this topic in Chapter 3.


[i]       Data: R. Bintanja and R.S.W. van de Wal, “North American ice-sheet dynamics and the onset of 100,000-year glacial cycles.” Nature, Volume 454, 869-872, 14 August 2008. doi:10.1038/nature07158. National Centers for Environmental Information, NESDIS, NOAA, U.S. Department of Commerce. Global 3Ma Temperature, Sea Level, and Ice Volume Reconstructions. https://www.ncdc.noaa.gov/paleo-search/study/11933. Downloaded 10/27/2015. Personal Research: The temperature data for the first 2,100 years from the climate optimum was extracted for the last 34 glacial cycles. This temperature time-series was rebased to zero degrees and zero time so all glacial cycles could be compared on the same basis, i.e., from their peaks. The temperature declined by 0.610C after the Holocene Climate Optimum, which was 1.260C above the average of all other glacial cycles in 2,026,800 years. The current glacial cycle’s slow decline was not a significant outlier in the group.

Slowest ice age entry temperature decline in 800,000 years (Antarctica)

Slowest ice age entry temperature decline in 800,000 years (Antarctica)

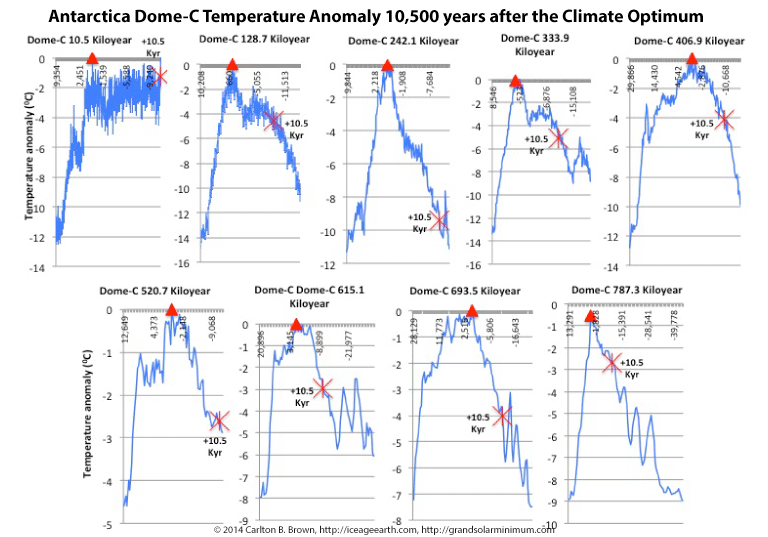
This ice age entry after the Holocene Climate Optimum is the slowest of to decline in temperature compared with all eight previous glacial cycles in the last 800,000 years (Antarctica). If the Antarctic climate system has a tendency to revert to the mean, then it will undergo a significant cooling during the 21st century.

Ice core temperature data from Antarctica’s EPICA Dome C reveals that the temperature has only declined by 1.20C (top left figure) since the Holocene Climate Optimum 10,527 years ago. The comparator group of all eight previous glacial cycles declined on average by 4.30C, 10,500 years after their respective climate optima (red triangle shapes).

The temperature decline since the Holocene Climate Optimum 10,500 years after the Antarctic’s Holocene Climate Optimum is the smallest decline compared with all glacial cycles in the past 800,000 years.[i] While this current Antarctic ice age inception temperature decline is the biggest outlier (i.e., slowest to cool), it is not a statistically significant outlier (i.e., P-value >0.05).

This data analysis suggests that if the climate system has a tendency to revert to the mean, then Antarctica will undergo a significant cooling phase during the 21st century.

Click on this page and download a free copy of my book “Revolution: Ice Age Re-Entry,” and read more about this topic in Chapter 3.


[i]       J.V. Jouzel et al., 2007, “Orbital and Millennial Antarctic Climate Variability over the Past 800,000 Years.” Science, Volume 317, No. 5839, 793-797, 10 August 2007. National Centers for Environmental Information, NESDIS, NOAA, U.S. Department of Commerce. EPICA Dome C – 800KYr Deuterium Data and Temperature Estimates. https://www.ncdc.noaa.gov/paleo/study/6080. Download data: Downloaded 08/02/2016.

A glacial cycle is comprised of sequential freeze-thaw phases

A glacial cycle is comprised of sequential freeze-thaw phases

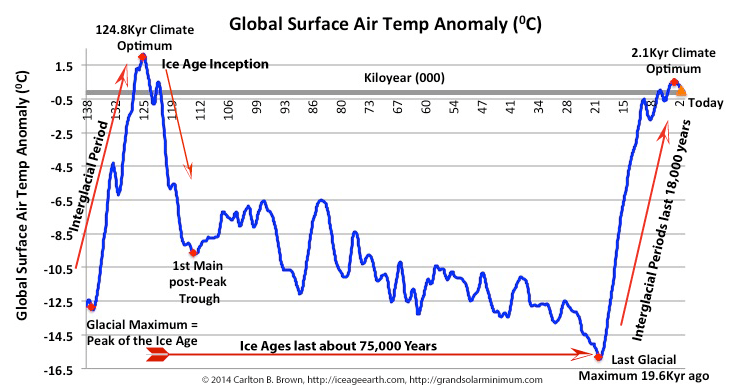
During the last 1 million years the average glacial cycle has lasted for 92,900 years, the average interglacial period was 18,200 years long, and the interglacial temperature rose on average 13.50C (global data). The average glacial period, or period of freezing, lasted about 74,700 years, from the climate optimum to the next glacial maximum.[i]

Each glacial cycle displays recurring phases and common points of reference such as a climate optimum, a glacial maximum, an interglacial period, and a first main trough after the climate optimum. Interglacial periods are warming phases that extend from the glacial maximum (i.e., peak of the ice age) to the climate optimum. The glacial maximum represents the lowest temperature of the glacial cycle, during which the maximum ice mass and lowest sea levels exist. A climate optimum represents the highest temperature period of the glacial cycle at the end of the interglacial period, during which ice mass is at its lowest and sea level is at its highest. Ice ages start after the climate optimum.

Click on this page and download a free copy of my book “Revolution: Ice Age Re-Entry,” and read more about this topic in Chapter 3.


[i]       Bintanja, R. and R.S.W. van de Wal, “North American ice-sheet dynamics and the onset of 100,000-year glacial cycles.” Nature, Volume 454, 869-872, 14 August 2008. doi:10.1038/nature07158. National Centers for Environmental Information, NESDIS, NOAA, U.S. Department of Commerce. Global 3Ma Temperature, Sea Level, and Ice Volume Reconstructions. https://www.ncdc.noaa.gov/paleo-search/study/11933. Downloaded 10/27/2015.

Solar activity controls the climate system, and global warming started in 1700

Solar activity controls the climate system, and global warming started in 1700

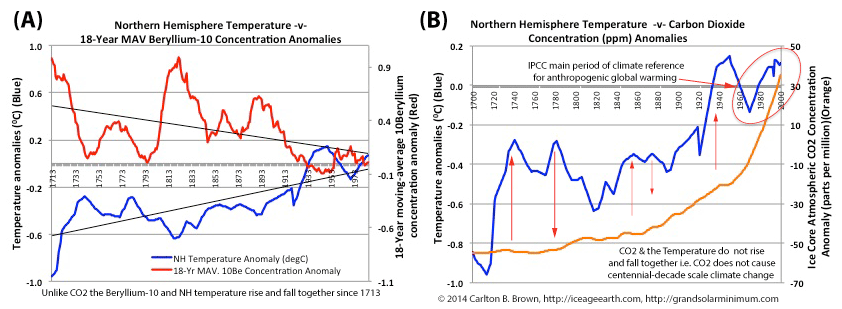
Solar activity (magnetism) controls centennial-scale climate change, not carbon dioxide. Global warming started in 1700 before significant human activity. The rise in carbon dioxide (CO2) concentrations lags the global temperature rise, while CO2 does not track decadal-scale climate change (i.e., the temperature ups and downs). The Intergovernmental Panel on Climate Change (IPCC) “anthropogenic global warming” story started after 1880 and is a partial fragment of this natural global warming phase.

The 1700–2016 CE centennial-scale warming phase was the most extreme statistical “outlier” climate oscillation in 8,000 years. Even at 2016’s global warming temperature peak, the Arctic temperatures were still 2-4C lower than at the Holocene Climate Optimum 8,000 years ago.[i],[ii],[iii] Today’s temperature is not the highest on record, as claimed by the IPCC.[iv]

Figure A) above: The Northern Hemisphere temperature anomaly highlights a strong inverse correlation with the 18-year moving average Beryllium-10 concentration anomaly (“Beryllium-10”, is a proxy for solar activity). In 1711, the 18-year moving average Beryllium-10 began its decline phase (i.e., coinciding with an increase in solar activity). The temperature rise began two years later in 1713, which was the lowest temperature since the Holocene Climate Optimum. Figure A tells us the temperature lagged behind the rise in solar activity.

The use of an 18-year moving average for the Beryllium-10 concentration anomaly means the temperature, in reality, lagged the solar activity by at least one 11-year solar cycle (see citation for why).[v] These two parameters also well tracked one another’s up and down variations, putatively supporting a cause-and-effect relationship.

By contrast, since 1713 the rising carbon dioxide concentration has poorly tracked the Northern Hemisphere temperature volatility on multi-annual and decade time-scales (see Figure B). This indicates carbon dioxide is consequential to, and not causative of, the 1700-2000 temperature rise.[vi]

The above conclusion that carbon dioxide follows (i.e., does not cause) the temperature rise is fully aligned with the science of carbon dioxide and earth’s climate. This science tells us the historical global temperature changes preceded changes in carbon dioxide concentrations by many centuries on glacial cycle time scales.[vii],[viii],[ix],[x]

On multi-decade timescales the carbon dioxide concentration rise lags the temperature rise by many months.[xi] This means that global mean land surface, ocean surface, and stratospheric temperature changes precede changes in atmospheric carbon dioxide concentration (as Figure B indicates). One of these publications concludes that the elevated atmospheric carbon dioxide results from ocean degassing due to warmer oceans (plus human activity) consequent to increased solar activity.[xii]

Click on this page and download a free copy of my book “Revolution: Ice Age Re-Entry,” and read more about this topic in Chapters 4 and 1-2.


[i]       Nicolaj K. Larsen et al., “The response of the southern Greenland ice sheet to the Holocene thermal maximum.” Geology ; 43 (4): 291–294. doi: https://doi.org/10.1130/G36476.1.

[ii]       D.S. Kaufman et al., “Holocene thermal maximum in the western Arctic (0–1800W).” Quaternary Science Reviews 23 (2004) 529–560.

[iii]      J.P. Briner et al., “Holocene climate change in Arctic Canada and Greenland.” Quaternary Science Reviews (2016), http://dx.doi.org/10.1016/j.quascirev.2016.02.010.

[iv]      Highest temperature on record. IPCC, Climate Change 2007: The Physical Science Basis. Contribution of Working Group I to the Fourth Assessment Report of the Intergovernmental Panel on Climate Change [Solomon, S., D. Qin, M. Manning, Z. Chen, M. Marquis, K.B. Averyt, M. Tignor and H.L. Miller (eds.)]. Cambridge University Press, Cambridge, United Kingdom and New York, NY, USA, 996 pages [Exposé: See page 288. The IPCC tells us the 1998 global mean air temperature was the highest on record until 2005.].

[v]      This 11-year solar cycle lag (approximate) is composed of 9 years (i.e., half of a 18-year moving average), plus a two year lag in the temperature rise (behind the Beryllium-10 rise), plus one year before the newly produced Beryllium-10 in the upper atmosphere reaches earth’s surface where it can be incorporated in ice cores (and thus be measured)(Beryllium-10 atmospheric residence time: R.C. Finkel and K. Nishiizumi, 1997, “Beryllium 10 concentrations in the Greenland Ice Sheet Project 2 ice core from 3–40 ka.” J. Geophys. Res., 102(C12), 26699–26706, doi: 10.1029/97JC01282).

[vi]     Data: (1) A.M. Berggren et al., 2009, “A 600-year annual 10Be record from the NGRIP ice core, Greenland.” Geophysical Research Letters, 36, L11801, doi:10.1029/2009GL038004. National Centers for Environmental Information, NESDIS, NOAA, U.S. Department of Commerce. North GRIP – 600 Year Annual 10Be Data. https://www.ncdc.noaa.gov/paleo-search/study/8618. Downloaded 05/05/2018. (2) T. Kobashi et al., 2013, “Causes of Greenland temperature variability over the past 4000 years: implications for northern hemispheric temperature changes.” Climate of the Past, 9(5), 2299-2317. doi: 10.5194/cp-9-2299-2013. National Centers for Environmental Information, NESDIS, NOAA, U.S. Department of Commerce. Northern Hemisphere 4000 Year Temperature Reconstructions. https://www.ncdc.noaa.gov/paleo/study/15535. Downloaded 05/05/2018. (3) Etheridge, D.M., et al., 2001, “Law Dome Atmospheric CO2 Data,” IGBP PAGES/World Data Center for Paleoclimatology. Data Contribution Series #2001-083. NOAA/NGDC Paleoclimatology Program, Boulder CO, USA. https://www1.ncdc.noaa.gov/pub/data/paleo/icecore/antarctica/law/law2006.xls. Downloaded 28 August 2018. Personal Research: A 18-year moving average of the Beryllium-10 concentration anomaly (relative to the 1960-1986 average) and carbon dioxide concentration anomaly (relative to the 1961-1990 average) were rendered from the raw data and plotted against the Northern Hemisphere temperature anomaly (relative to the 1961-1990 average) to create Figures 4.3.A and B.]

[vii]    Manfred Mudelsee, “The phase relations among atmospheric CO2 content, temperature and global ice volume over the past 420 ka.” Quaternary Science Reviews 20 (2001) 583-58.

[viii]   Eric Monnin et al., “Atmospheric CO2 Concentrations over the Last Glacial Termination.” By Science 05 Jan 2001: 112-114.

[ix]     N. Caillon et al., 2003, “Timing of atmospheric CO2 and Antarctic temperature changes across Termination III.” Science 299: 1728-1731.

[x]      H. Fischer et al., 1999, “Ice core records of atmospheric CO2 around the last three glacial terminations.” Science, 283, 1712-1714.

[xi]     Ole Humlum et al., “The phase relation between atmospheric carbon dioxide and global temperature.” Global and Planetary Change. Volume 100, January 2013, 51-69.

[xii]    Ole Humlum et al., “The phase relation between atmospheric carbon dioxide and global temperature.” Global and Planetary Change. Volume 100, January 2013, 51-69.

Cold climates follow a grand solar minimum of solar activity (magnetism)

Cold climates follow a grand solar minimum of solar activity (magnetism)

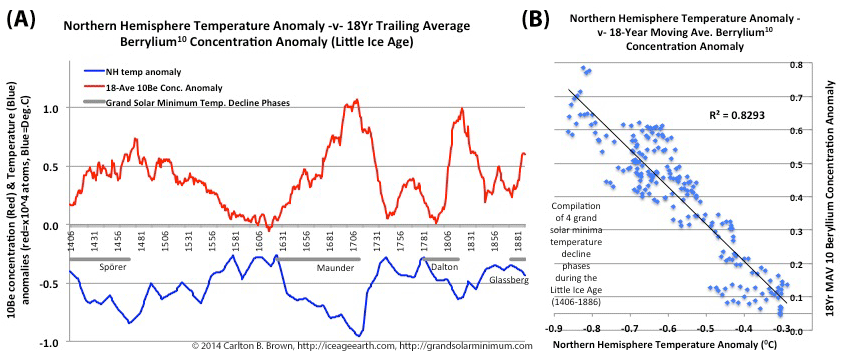
A cold climate was experienced in the Northern Hemisphere during the grand solar minima of the Little Ice Age. The cold climate lagged behind the decline phase of solar activity (rise in Beryllium-10 concentration anomaly).

Figure A) For the years 1406 to 1889, a statistically significant inverse relationship exists between the Northern Hemisphere temperature (blue line) and the solar activity proxy (i.e., 18-year moving average Beryllium 10 concentration anomaly)(red line)—that is, for 484 years of the Little Ice Age period. Both data parameter variations also tracked one another’s variations to a high degree, putatively indicating a cause-and-effect relationship. The correlation was maximized using an 18-year moving average of the Beryllium-10 concentration anomaly, over the raw Beryllium-10 data and a 5-year and 11-year moving average. The use of the 18-year moving average is the equivalent of saying the temperature lags behind the solar activity by about one 11-year solar cycle (see citation for why).[i] Beryllium-10 is produced in the atmosphere by high-energy cosmic ray collisions with oxygen and nitrogen atoms, and is a well-established proxy for solar activity. High Beryllium-10 ice core concentrations indicate low levels of solar activity, and vice versa.[ii]

Figure B) All four grand solar minima of the Little Ice Age were characterized by a strengthening of the relationship between the increasing 18-year moving average Beryllium-10 concentration anomaly and the declining Northern Hemisphere temperature anomaly. See the citation for the detailed analysis summary for Figures A and B.[iii]

Between 1400 and 1900, the Northern Hemisphere was on average about 10C colder than in the late 20th century, with this varying on a regional basis. The coldest region during the Little Ice Age was the Atlantic sector of the Arctic.[iv],[v] All four officially recognized grand solar minima of the Little Ice Age were associated with troughs in temperature in the Northern Hemisphere. These Little Ice Age grand solar minima were the Wolf (1280-1350), Spörer (1450-1550), Maunder (1645-1715), and Dalton (1790-1830) minima. These grand solar minima also coincided with the biggest glacier ice advances experienced since the Holocene Climate Optimum.[vi]

Based on the strong correlation between solar activity (Beryllium-10) and the Northern Hemisphere temperature during the Little Ice Age, if this relationship is repeated during this grand solar minimum, then the planet will cool. This conclusion is fully aligned with the consensus conclusion of solar scientists who are experts in climate change.[vii],[viii],[ix],[x],[xi],[xii],[xiii]

Click on this page and download a free copy of my book “Revolution: Ice Age Re-Entry,” and read more about this topic in Chapter 4.


[i]       This 11-year solar cycle lag (approximate) is composed of 9 years (i.e., half of a 18-year moving average), plus a two year lag in the temperature rise (behind the Beryllium-10 rise), plus one year before the newly produced Beryllium-10 in the upper atmosphere reaches earth’s surface where it can be incorporated in ice cores (and thus be measured)(Beryllium-10 atmospheric residence time: R.C. Finkel and K. Nishiizumi, 1997, “Beryllium 10 concentrations in the Greenland Ice Sheet Project 2 ice core from 3–40 ka.” J. Geophys. Res., 102(C12), 26699–26706, doi: 10.1029/97JC01282).

[ii]      I.G.M. Usoskin et al., “Solar activity, cosmic rays, and Earth’s temperature: A millennium-scale comparison.” Journal of Geophysical Research, 110, A10102, doi:10.1029/2004JA010946. [Exposé: See page 1. This tells us cosmogenic isotopes (Beryllium-10, Carbon-14) are used as proxies for solar activity, and that their production is caused by galactic cosmic ray flux, which is influenced by the solar system’s (heliospheric) magnetic field and is modulated by solar activity. Comment: Magnetized solar wind modulates the solar system’s magnetic shield (i.e., the heliosphere) and the earth’s magnetic shield (i.e. the magnetosphere), thereby regulating cosmic ray entry into the solar system and the earth system respectively. Cosmic ray entry into the upper atmosphere from space is modulated by solar activity and geomagnetism. Lower solar activity and lower geomagnetism permit more cosmic ray entry into the atmosphere, and conversely. Increased cosmic ray levels are associated with increased low-cloud formation, which is associated with planetary cooling, and conversely. The cosmic ray and low-cloud cooling effect are concentrated into the polar regions. Cosmogenic isotopes (Carbon-14, Beryllium-10) are generated by cosmic rays in the atmosphere, with more cosmic rays generating more cosmogenic isotopes, and conversely. Cosmogenic isotopes are then embedded in earth repositories (i.e., tree rings, ice cores) and therefore indirectly tell us about solar activity and the resulting magnetized solar wind that contacts the earth’s magnetosphere. By utilizing cosmogenic isotopes to assess relationships between the sun and earth systems (i.e., climate, volcanism) we know that the solar activity that is being assessed is magnetism based, and not electromagnetism (i.e. not solar irradiance).].

[iii]     Data: (1) A.M. Berggren et al., 2009, “A 600-year annual 10Be record from the NGRIP ice core, Greenland.” Geophysical Research Letters, 36, L11801, doi:10.1029/2009GL038004. National Centers for Environmental Information, NESDIS, NOAA, U.S. Department of Commerce. North GRIP – 600 Year Annual 10Be Data. https://www.ncdc.noaa.gov/paleo-search/study/8618. Downloaded 05/05/2018. (2) T. Kobashi et al., 2013, “Causes of Greenland temperature variability over the past 4000 year: implications for Northern Hemispheric temperature changes.” Climate of the Past, 9(5), 2299-2317. doi: 10.5194/cp-9-2299-2013. National Centers for Environmental Information, NESDIS, NOAA, U.S. Department of Commerce. Northern Hemisphere 4000 Year Temperature Reconstructions. https://www.ncdc.noaa.gov/paleo/study/15535. Downloaded 05/05/2018. Statistics Software Utilized: Spearman rank calculator utilized: Wessa P., (2017), Spearman Rank Correlation (v1.0.3) in Free Statistics Software (v1.2.1), Office for Research Development and Education, URL https://www.wessa.net/rwasp_spearman.wasp/. Personal Research: Figure 4.4.A.) Spearman rank correlation r= -0.76, two-tailed P-value = <0.00001, N=484 annual pairings. Both the Northern Hemisphere temperature and the Beryllium-10 concentration anomaly (18-year moving average) anomalies were not normally distributed, though they did not contain outliers. A scatter plot of the data indicated a linear relationship. A Spearman rank correlation was utilized given the non-normal distributions. The correlation was optimized using an 18-year moving average Beryllium-10 concentration anomaly. This 18-year moving average was selected using the scatterplot trend line in Microsoft Excel to maximize the R-squared (versus an 11-year, 5-year, and no moving average). Figure B) A Spearman rank correlation r= -0.876, two-tailed P-value = <0.00001, N=205 annual pairings. A Pearson correlation r= -0.91, two-tailed P-value = <0.00001, N=205. The grand solar minima temperature decline phases and their corresponding 18-year trailing average Beryllium-10 data were extracted from the full data set and compiled into a single time series (as linked sequential periods). Each grand solar minimum period was analyzed as a stand-alone grand solar minimum data set (Data not shown) and as fusion of four grand solar minima. The results and conclusion are the same. The temperature data is normally distributed. The 18-year moving average Beryllium-10 concentration anomaly is not normally distributed, indicated by a d’Agostino-Pearson test that yielded a p=0.019, indicating a non-normal distribution. However, the scatter plot demonstrates a linear relationship, and there were no outliers. The correlation was optimized using a 18-year moving average Beryllium-10 concentration anomaly, selected using the scatterplot trend line in Microsoft Excel to maximize the R-squared (versus an 11-year, 5-year, and no moving average). Note: A Pearson correlation was also calculated for both data sets supporting Figures 4.4.A and B, yielding a similar level of correlation, statistical significance, and the same conclusion (Data not shown).

[iv]     Michael E Mann, “Little Ice Age.” Volume 1, The Earth system: physical and chemical dimensions of global environmental change, 504–509, citing see Bradley and Jones, 1993; Pfister, 1995

[v]      G.H. Miller et al., “Temperature and precipitation history of the Arctic.” Quaternary Science Reviews, Volume 29, Issues 15–16, 2010. 1679-1715. https://doi.org/10.1016/j.quascirev.2010.03.001.

[vi]     O.N. Solomina et al., 2016, “Glacier fluctuations during the past 2000 years.” Quaternary Science Reviews, 149, 61-90. DOI: 10.1016/j.quascirev.2016.04.008. [See Figure 5, page 276. This figure collates a stacked time series of the number of glacier advances and recessions in each region into a global total.].

[vii]    N. Scafetta, “Multi-scale harmonic model for solar and climate cyclical variation throughout the Holocene based on Jupiter-Saturn tidal frequencies plus the 11-year solar dynamo cycle.” Journal of Atmospheric and Solar-Terrestrial Physics (2012). doi:10.1016/j.jastp.2012.02.016.

[viii]   Theodor Landscheidt, “New Little Ice Age Instead of Global Warming?” Energy & Environment. 2003. Volume 14, Issue 2, 327 – 350. https://doi.org/10.1260/095830503765184646.

[ix]     R.J. Salvador, “A mathematical model of the sunspot cycle for the past 1000 years.” Pattern Recognition Physics, 1, 117-122, doi:10.5194/prp-1-117-2013, 2013.

[x]      Habibullo Abdussamatov, “Current Long-Term Negative Average Annual Energy Balance of the Earth Leads to the New Little Ice age.” Thermal Science. 2015 Supplement, Volume 19, S279-S288.

[xi]     Jan-Erik Solheim, https://www.mwenb.nl/wp-content/uploads/2014/10/Blog-Jan-Erik-Solheim-def.pdf. Referred from http://www.climatedialogue.org/what-will-happen-during-a-new-maunder-minimum/. Citing blog for 4-5 solar-climate experts.

[xii]    Boncho P. Bonev et al., “Long-Term Solar Variability and the Solar Cycle in the 21st Century.” The Astrophysical Journal, 605:L81–L84, 2004 April 10.

[xiii]   Nils-Axel Mörner, “Solar Minima, Earth’s rotation and Little Ice Ages in the past and in the future. The North Atlantic–European case.” Global and Planetary Change 72 (2010) 282–293. doi:10.1016/j.gloplacha.2010.01.004.
Pin It on Pinterest